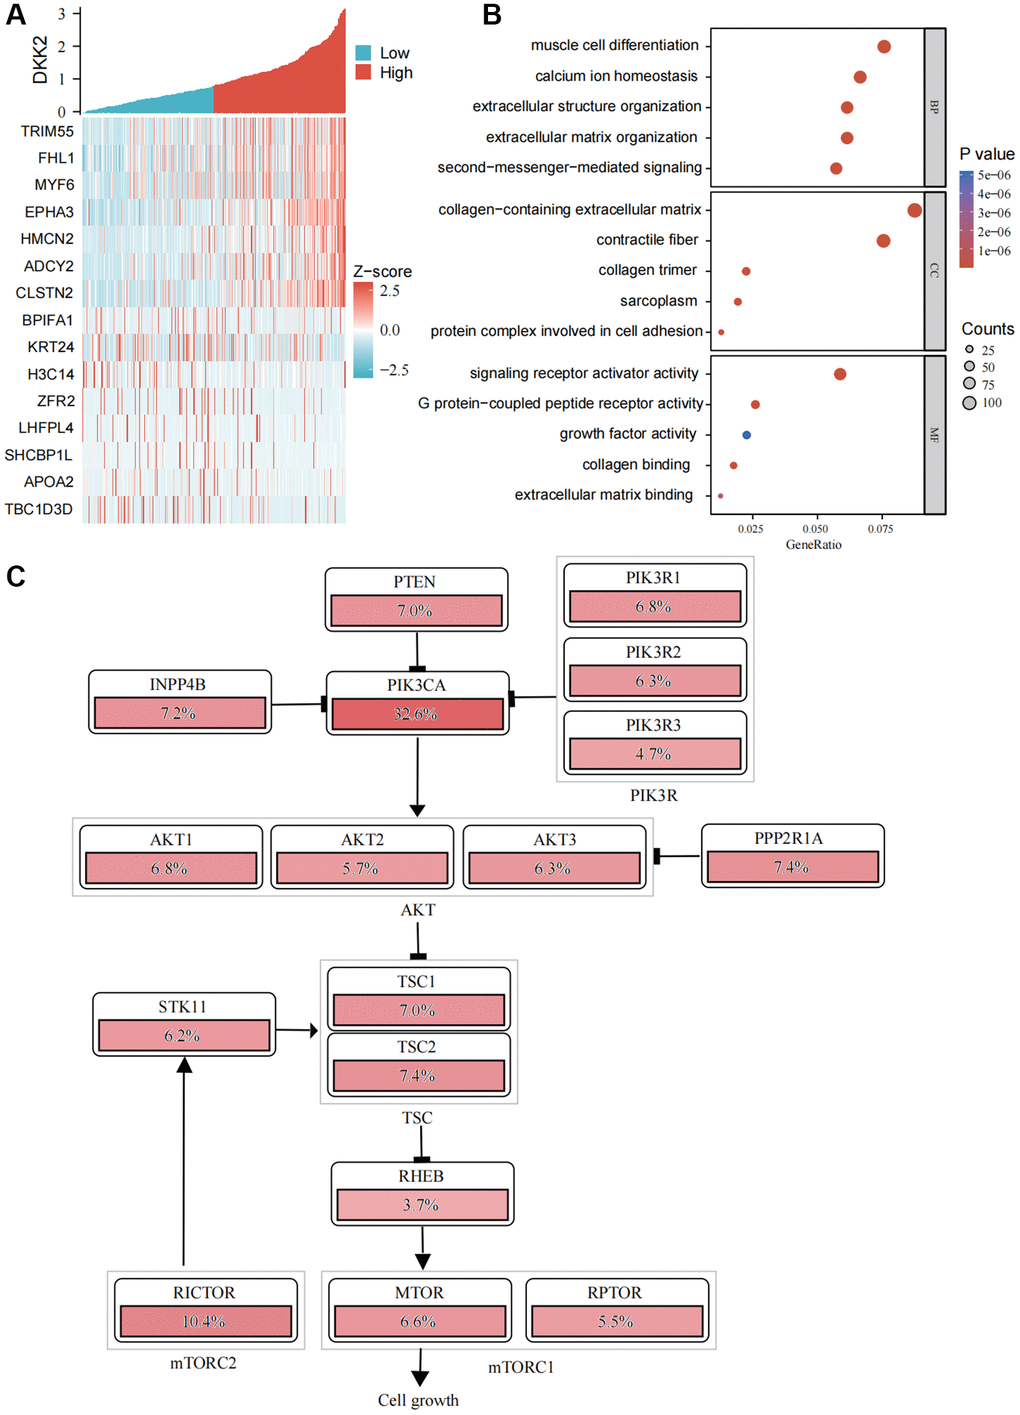
Figure 4.Functional enrichment analysis of DKK2. (A) Heatmap of DKK2 co-expressed genes in oral squamous cell carcinoma. (B) Gene Ontology enrichment analysis. (C) Schematic diagram of DKK2 affecting the PI3K/AKT signaling pathway. *p < 0.05; **p < 0.01; ***p < 0.001; ****p < 0.0001.