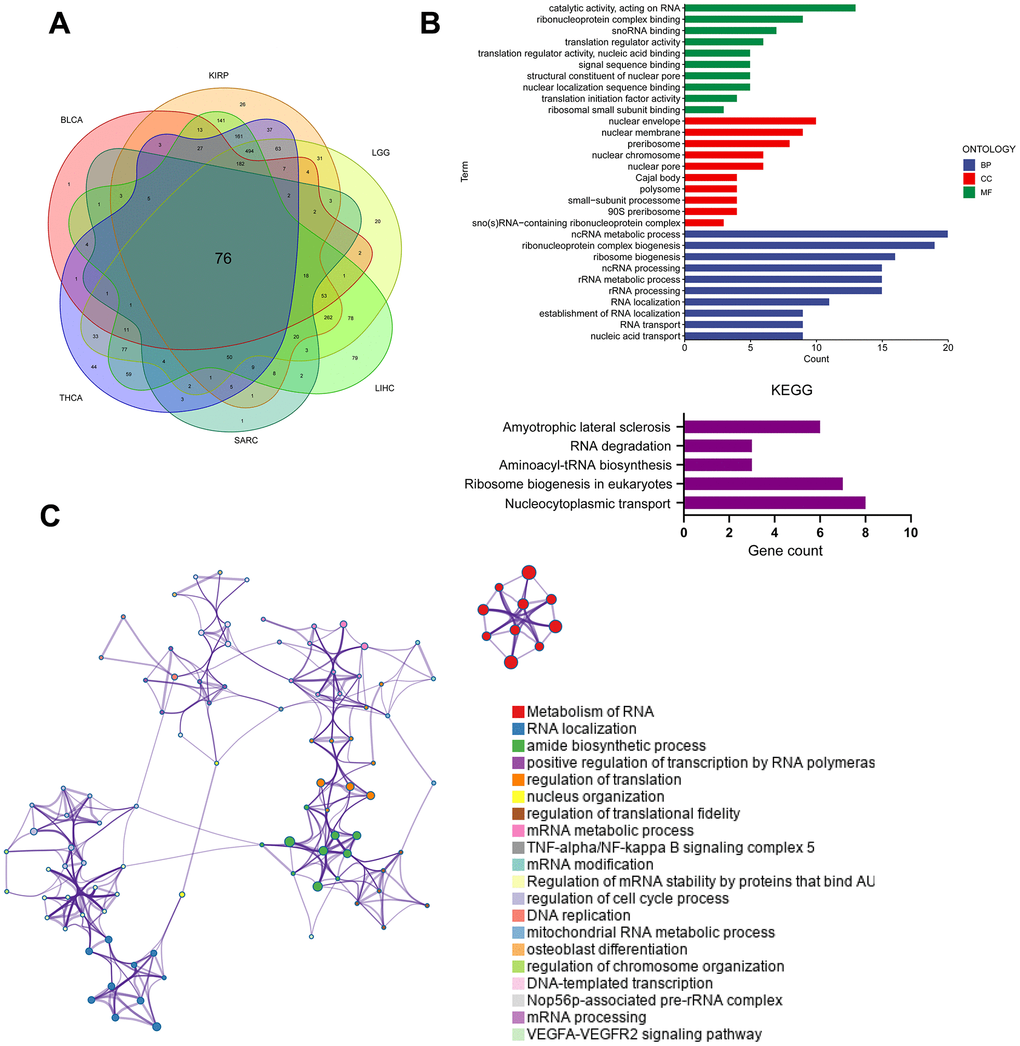
Figure 7.Analysis of PUS7-related regulatory pathways. (A) The intersecting genes which significantly correlated with DEGs were obtained using Spearman’s correlation analysis (p < 0.05, Cor > 0.4). (B) GO (top) and KEGG (bottom) analysis for the PUS7-related regulatory genes. (C) PUS7-related regulatory genes were mainly enriched in the mitotic cell cycle and DNA metabolic processes. The interactive network was constructed using the Meta scape online platform.