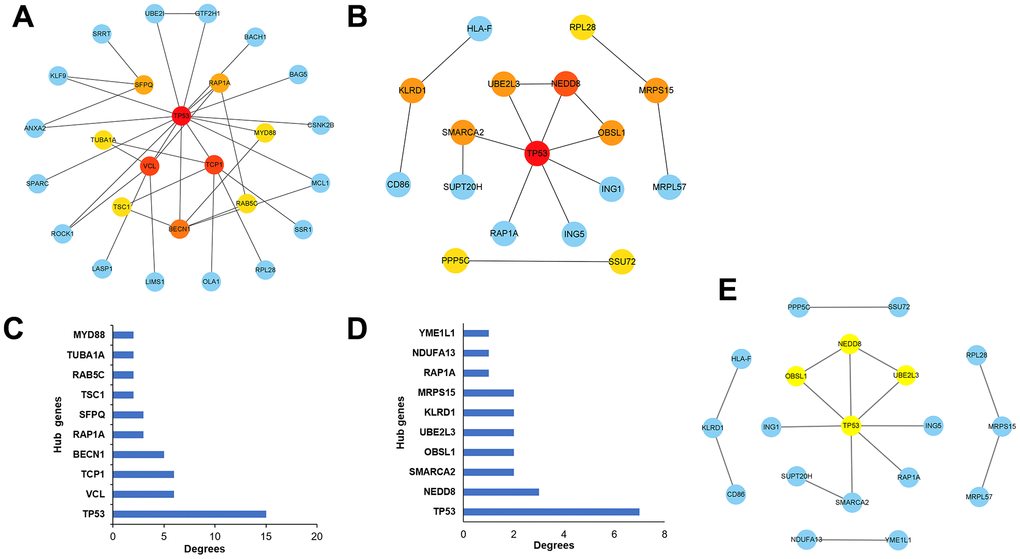
Figure 5.Selection of the hub genes associated with the development of alcoholic liver disease. (A) Visualizations of the hub genes associated with up-regulated differential expressed genes in the network. (B) Visualizations of the hub genes associated with down-regulated differential expressed genes in the network. (C) Bar graphs depicting the hub genes associated with up-regulated differential expressed genes. (D) Bar graphs depicting the hub genes associated with down-regulated differential expressed genes. (E) Key module analysis of the differentially expressed genes.