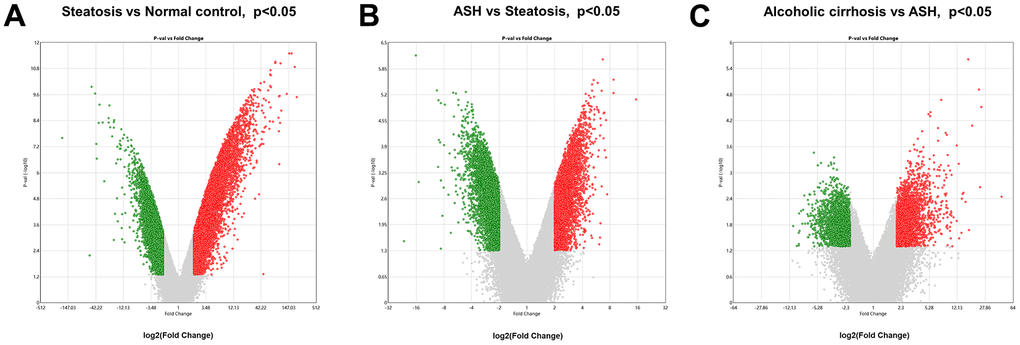
Figure 2.Analysis of differential gene expression in alcoholic liver disease. (A) DEGs1: Volcanic map of differential gene comparison between alcoholic fatty liver samples and normal samples. (B) DEGs2: Volcanic map of differential gene comparison between alcoholic hepatitis samples and alcoholic fatty liver samples. (C) DEGs3: Volcanic map of differential gene comparison between alcoholic cirrhosis and alcoholic hepatitis samples.