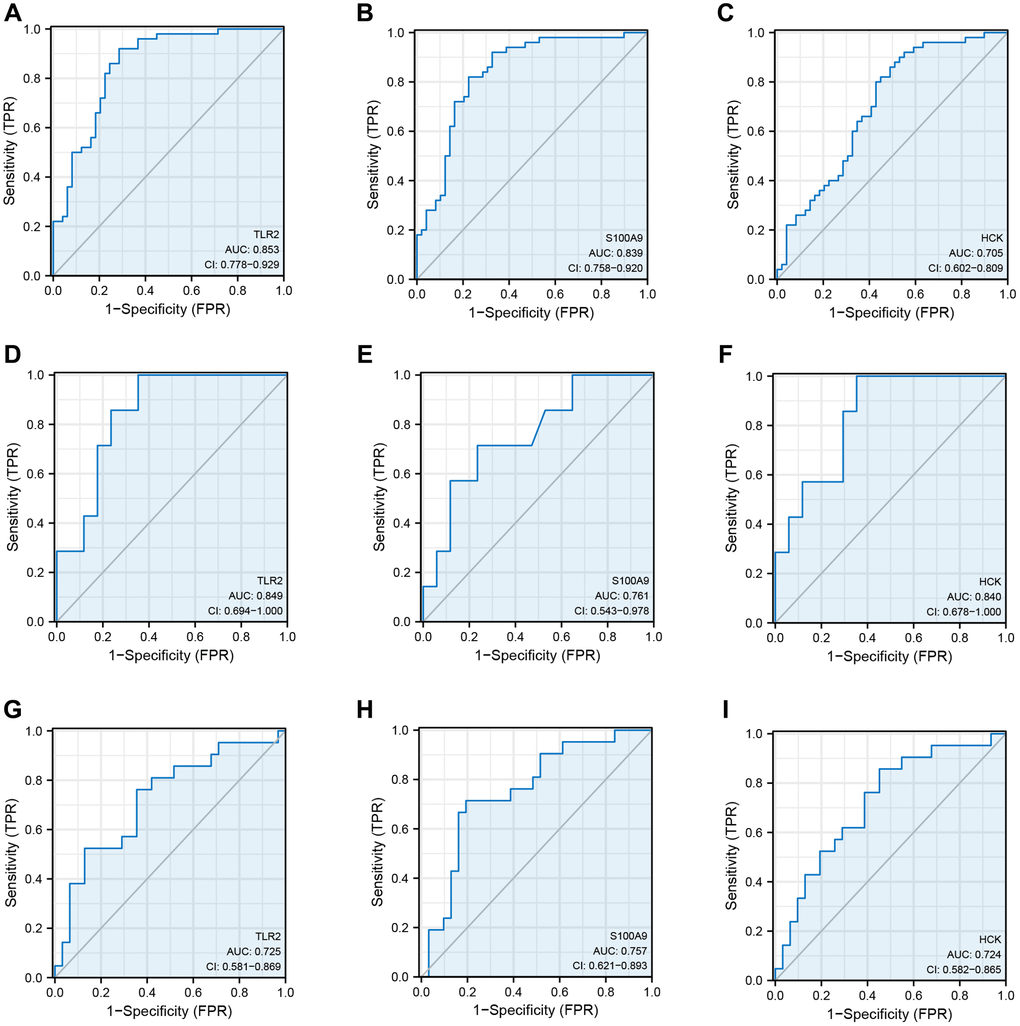
Figure 5.Receiver operating curve analysis of key genes. (A–C) ROC curve showing the diagnostic value of TLR2, S100A9, and HCK in GSE66360. (D–F) ROC curve showing the diagnostic value of TLR2, S100A9, and HCK in GSE60993. (G–I) ROC curve showing the diagnostic value of TLR2, S100A9, and HCK in GSE48060.