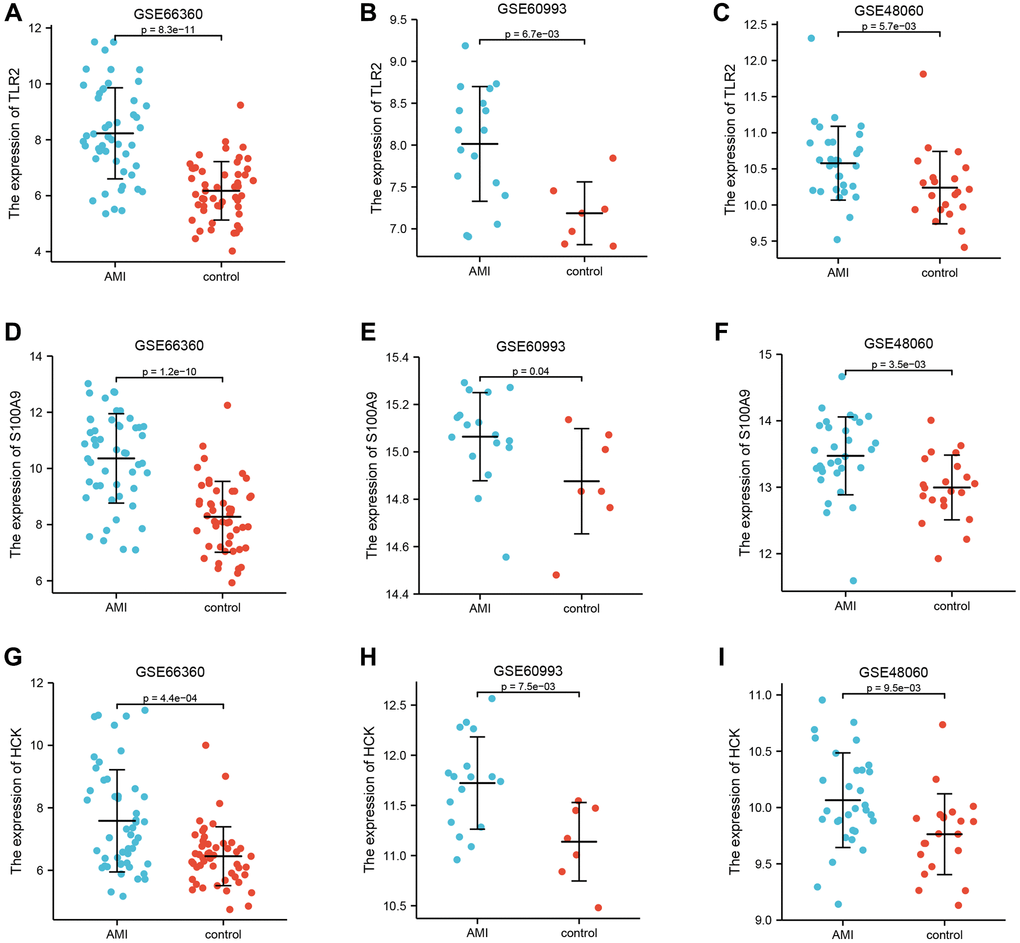
Figure 4.Differential expression of key genes. (A–C) Differential expression of TLR2 between AMI and control in GSE66360, GSE60993, and GSE48060. (D–F) Differential expression of S100A9 between AMI and control in GSE66360, GSE60993, and GSE48060. (G–I) Differential expression of HCK between AMI and control in GSE66360, GSE60993, and GSE48060.