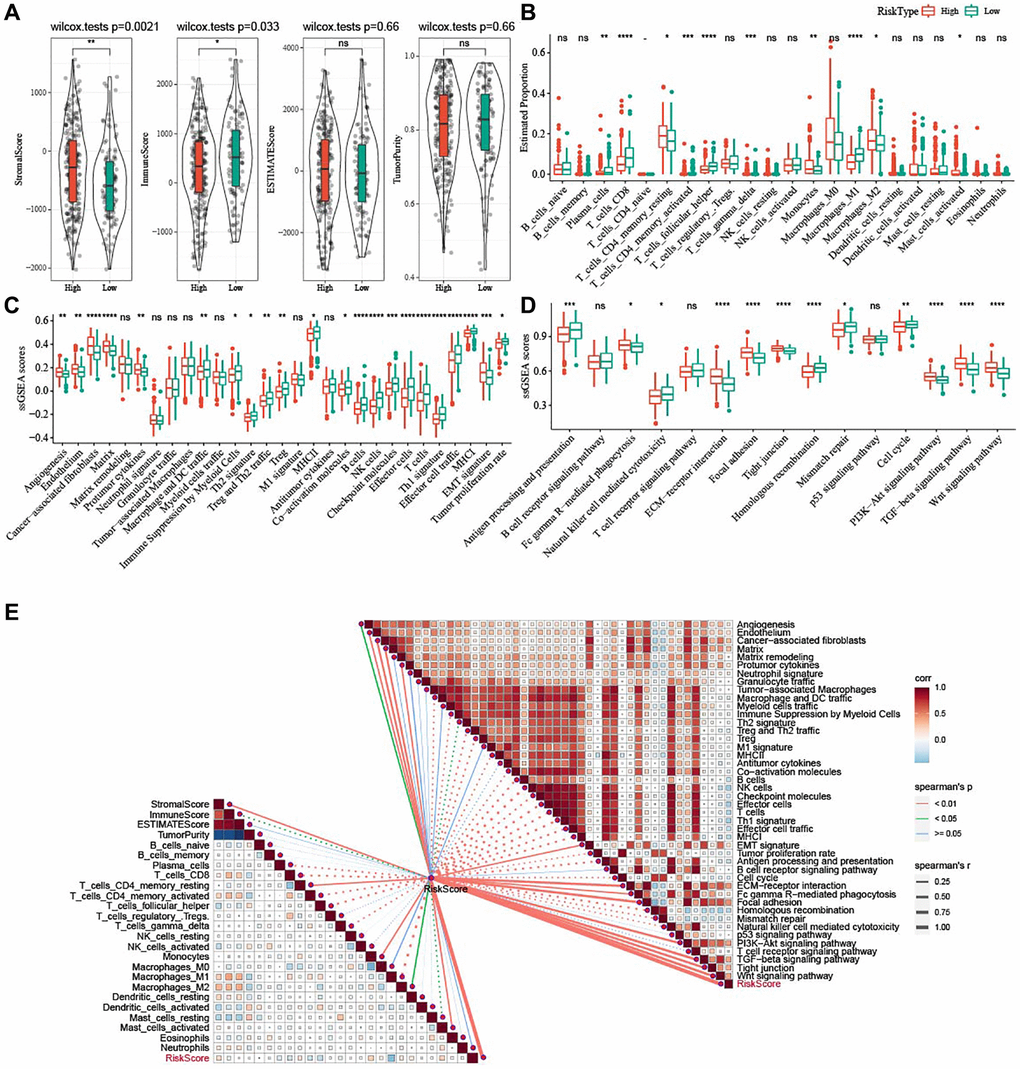
Figure 9.Potential immune characteristics of high- and low-risk groups. (A) Violin plots of ImmuneScore, StromalScore, ESTIMATEScore, and TumorPurity between the two risk groups in TCGA-OV cohort. (B) Box plots of 22 immune cells scores between the two risk groups in TCGA-OV cohort. (C) 29 TME-related gene signatures between the two risk groups in TCGA-OV cohort were shown in box plots. (D) 15 pathway-related gene signatures between high- and low-risk groups in TCGA-OV cohort were shown in box plots. (E) Correlation analysis between immune characteristics and risk score. nsP > 0.05; *P < 0.05, **P < 0.01, ***P < 0.001, and ****P < 0.0001.