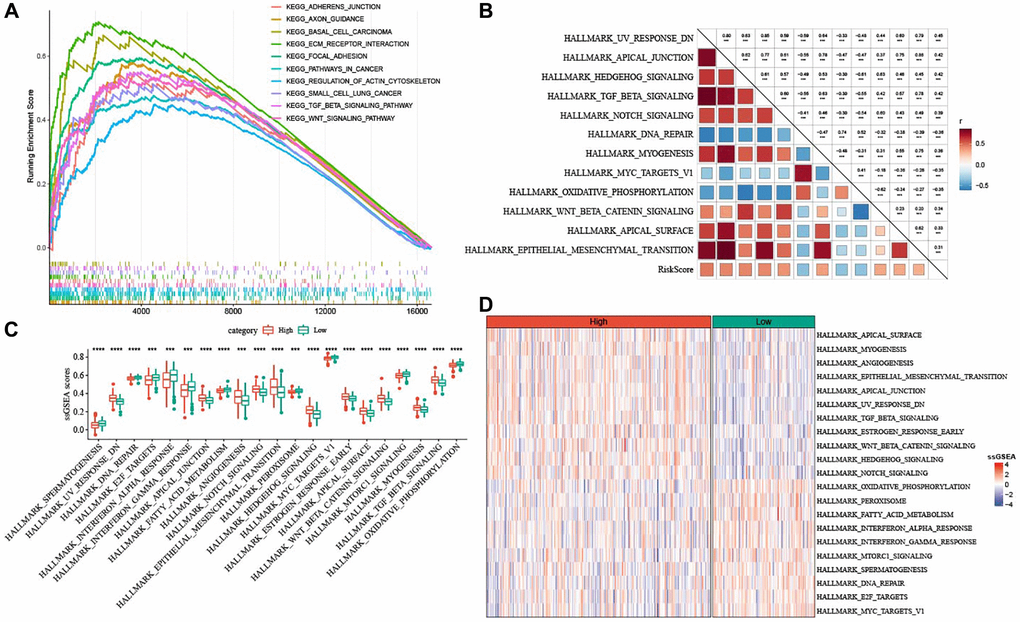
Figure 8.Pathway characteristics of high- and low-risk groups. (A) GSEA analysis between the two risk groups based on KEGG database. (B) Heatmap for the correlation between hallmark pathways and risk score. (C) Box plots of differential pathway ssGSEA scores between the two risk groups. (D) Heatmap of differential pathways between the two risk groups. ***P < 0.001, and ****P < 0.0001.