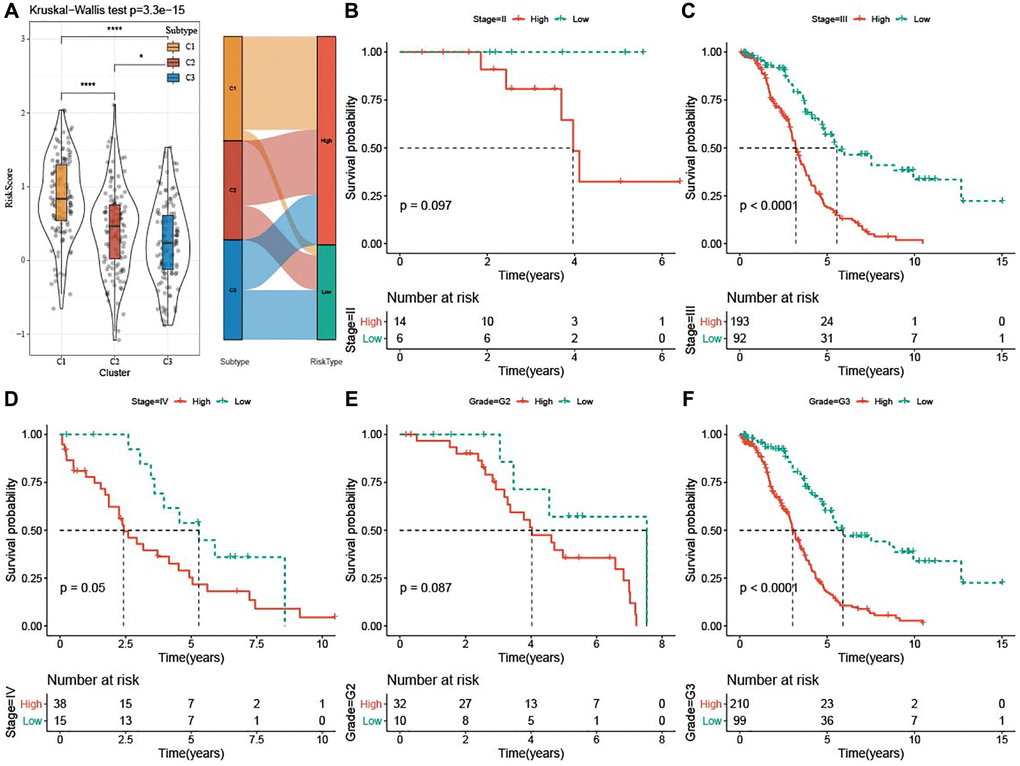
Figure 7.Clinical associations and prognosis analysis of risk score in TCGA-OV cohort. (A) Risk score among the three subtypes was shown in violin plots and Sankey diagram represented the distribution of three subtypes in low-risk and high-risk groups. (B–F) Kaplan-Meier curves for patients with different clinicopathological characteristics (Stage II–IV and Grade G2-G3) in the two risk groups. *P < 0.05 and ****P <0.0001.