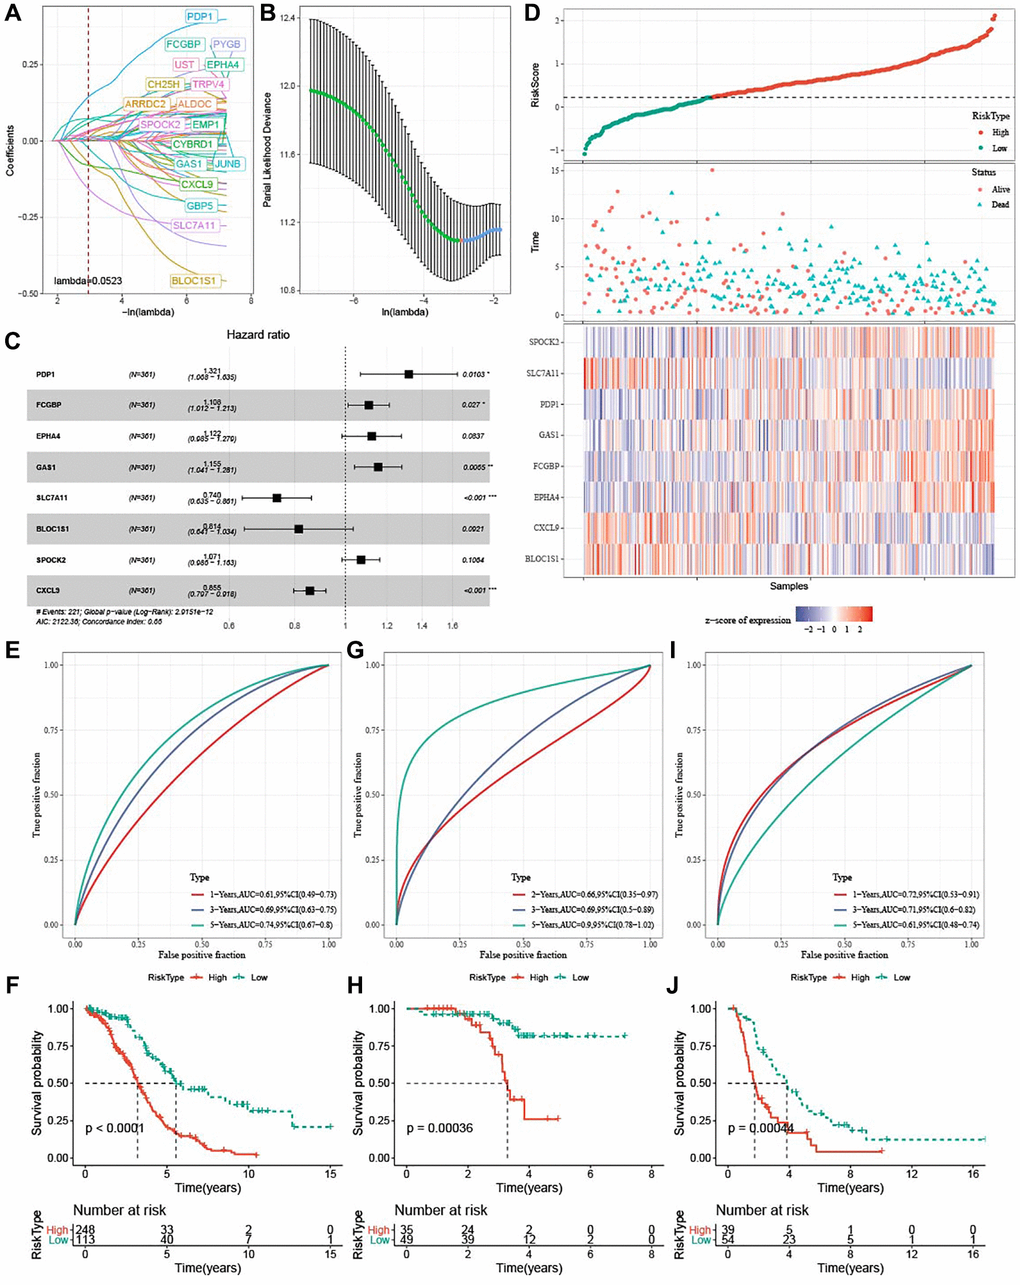
Figure 6.Development and verification of ferroptosis-based risk model. (A) Mutual increase between independent variable coefficients and lambda. A total of 18 genes were detected when lambda = 0.052. (B) The confidence interval under each lambda determined by 10-fold cross validation. (C) Forest plots of 8 ferroptosis-related prognostic genes TCGA-OV cohort. (D) Distributions of ferroptosis-related prognostic genes, risk score, survival status in TCGA-OV cohort. (E, F) ROC curves with AUCs and Kaplan-Meier curves plotted from patients with high and low risk in TCGA-OV cohort. (G, H) ROC curves with AUCs and Kaplan-Meier curves plotted from patients with low and high risk in GSE102073 cohort. (I–J) ROC curves with AUCs and Kaplan-Meier curves plotted from patients with low and high risk in ICGC-AU cohort.