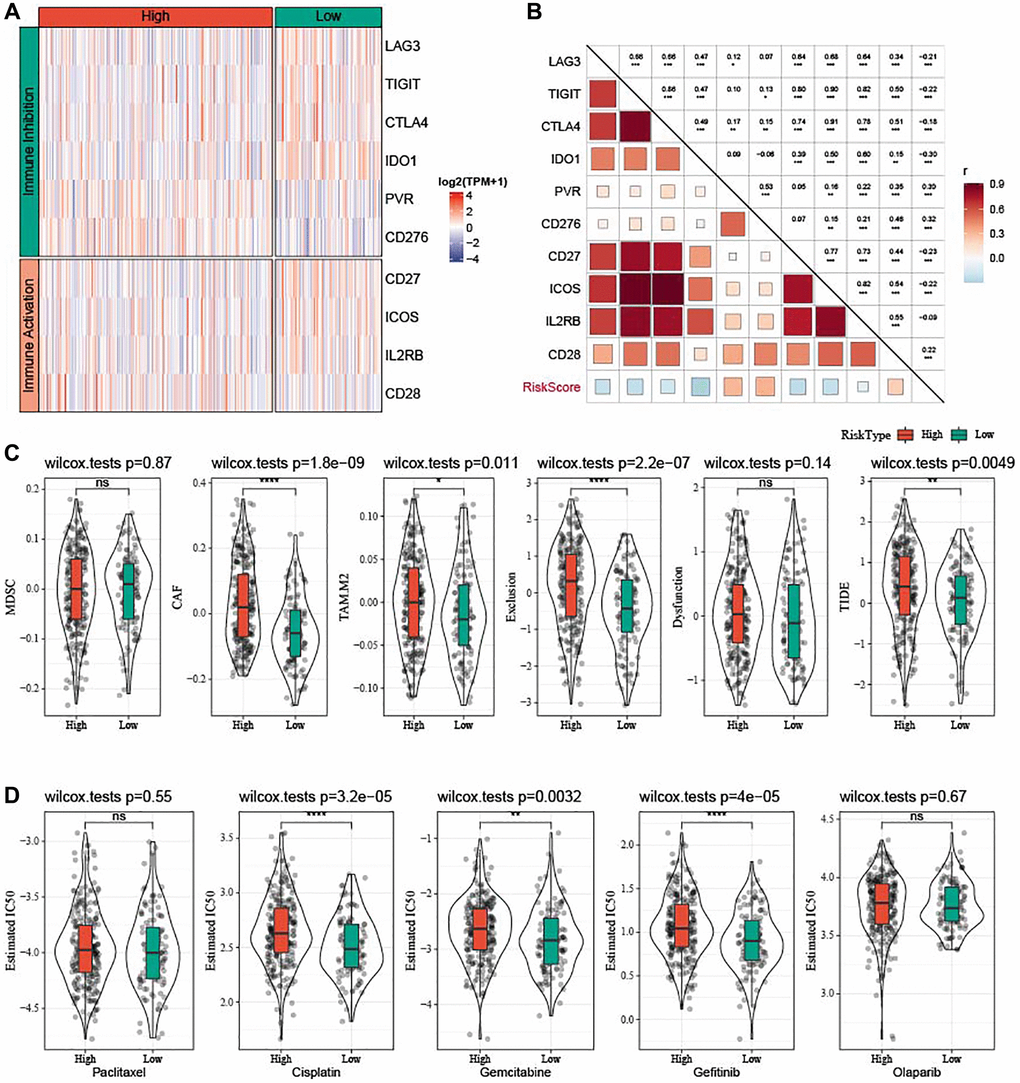
Figure 10.Prediction of responsiveness to immunotherapy and chemotherapy in TCGA-OV cohort. (A) Heatmap of differential expressed immune checkpoints between the two risk groups. (B) Correlation analysis between differential expressed immune checkpoints and risk score. (C) Violin plots of MDSC, CAF, TIDE, TAM.M2, exclusion, and dysfunction. (D) Estimated IC50 values for traditional chemotherapy drugs Paclitaxel, Cisplatin, Gemcitabine, Gefitinib, and Olaparib were shown in violin plots. nsP > 0.05; *P < 0.05, **P < 0.01, ***P < 0.001, and ****P < 0.0001.