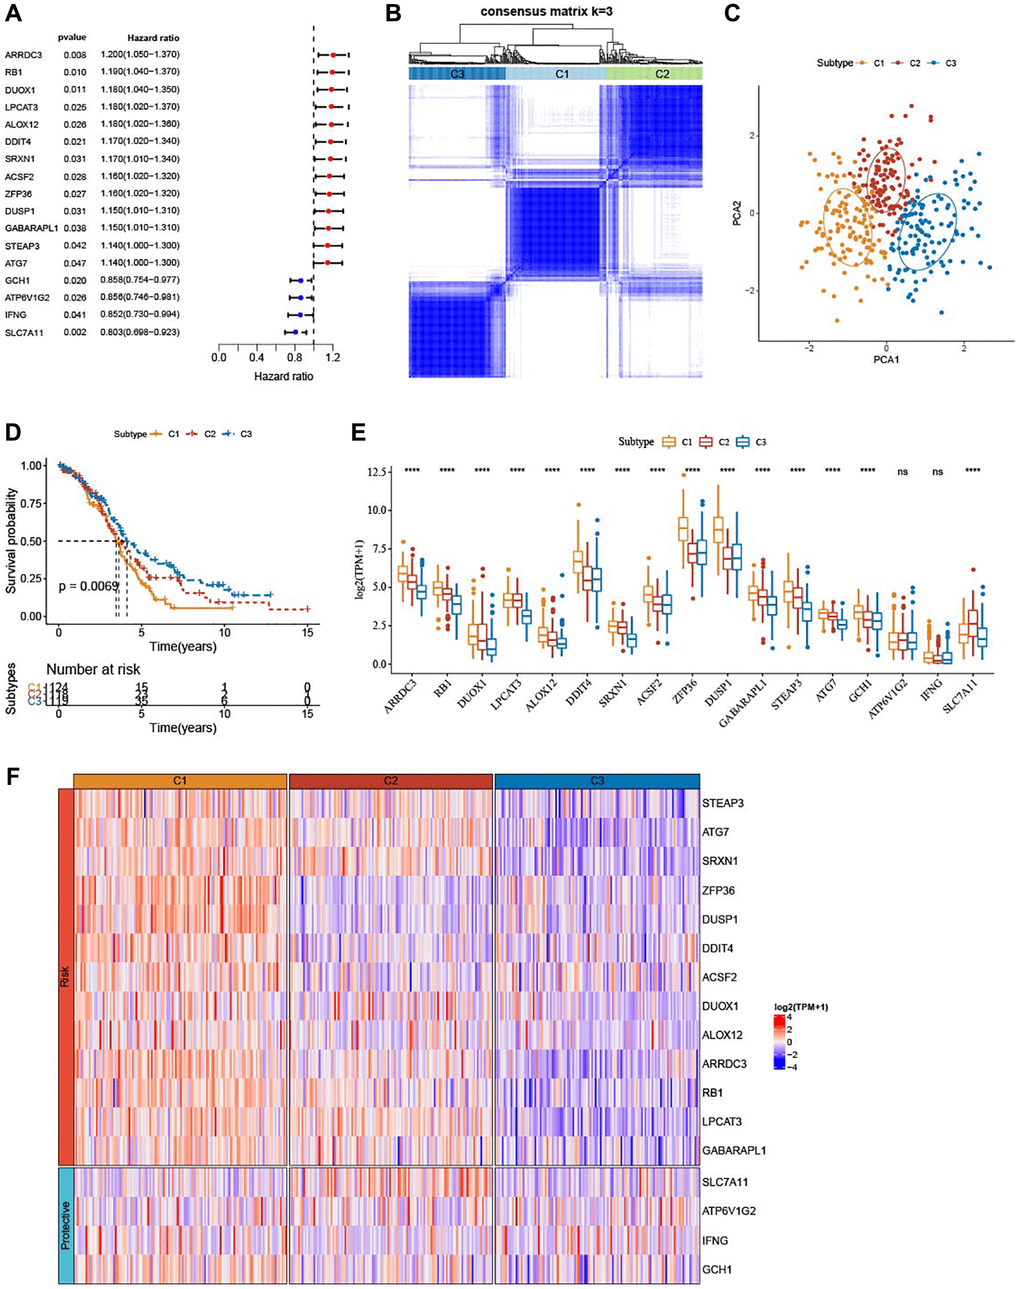
Figure 1.Identification of three ferroptosis-based subtypes. (A) Forest plots for a total of 17 ferroptosis-related genes in TCGA-OV cohort analyzed by univariate Cox regression study. (B) Three clusters (k = 3) were classified by consensus matrix heatmap defining. (C) The three subtypes showed distinct separation, shown by PCA analysis. (D) The three subtypes in TCGA-OV cohort were plotted for Kaplan-Meier curves. (E) Alterations of 17 genes related to ferroptosis in TCGA-OV cohort. (F) Heatmap portrayed the distributions of the genes related to ferroptosis among three subtypes. nsP > 0.05; ****P < 0.0001.