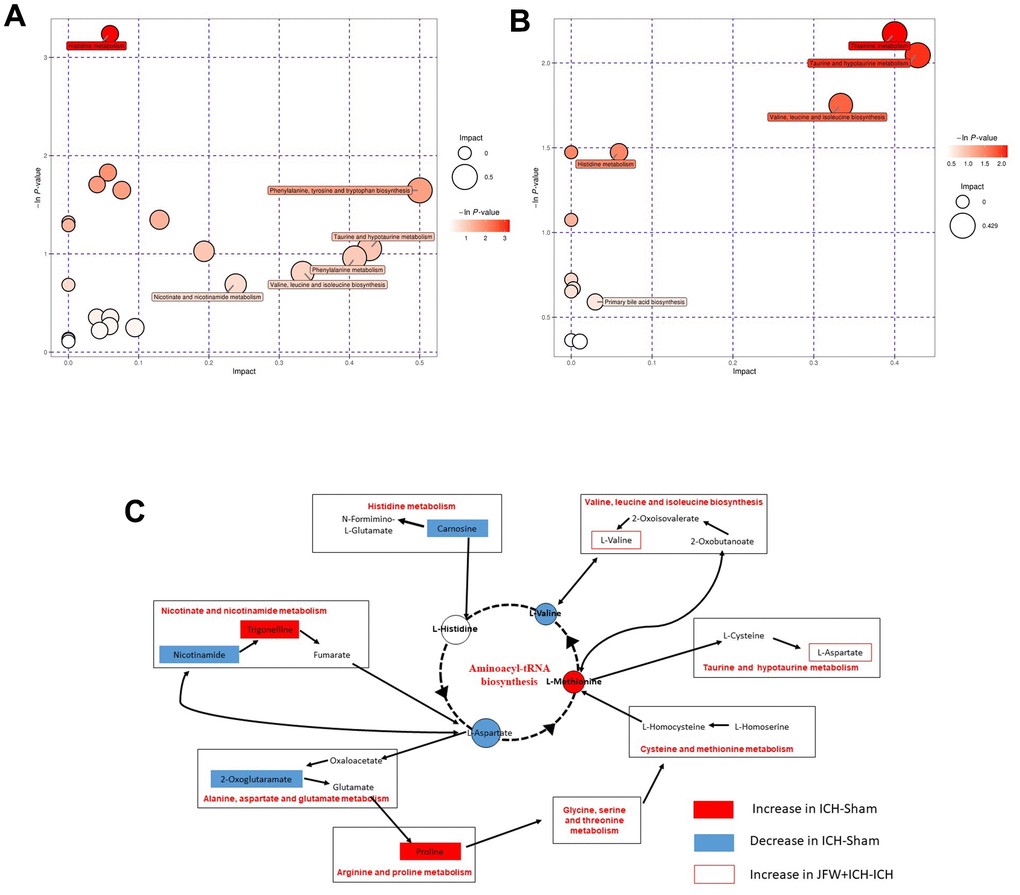
Figure 14.Comprehensive analysis of metabolic pathways. Each bubble in the bubble map represents a metabolic pathway. (A, B) The comparisons between ICH and Sham groups (A) or ICH + JFG and ICH groups (B) are showed. (C) Represents the metabolic pathways found by metabolomics analysis.