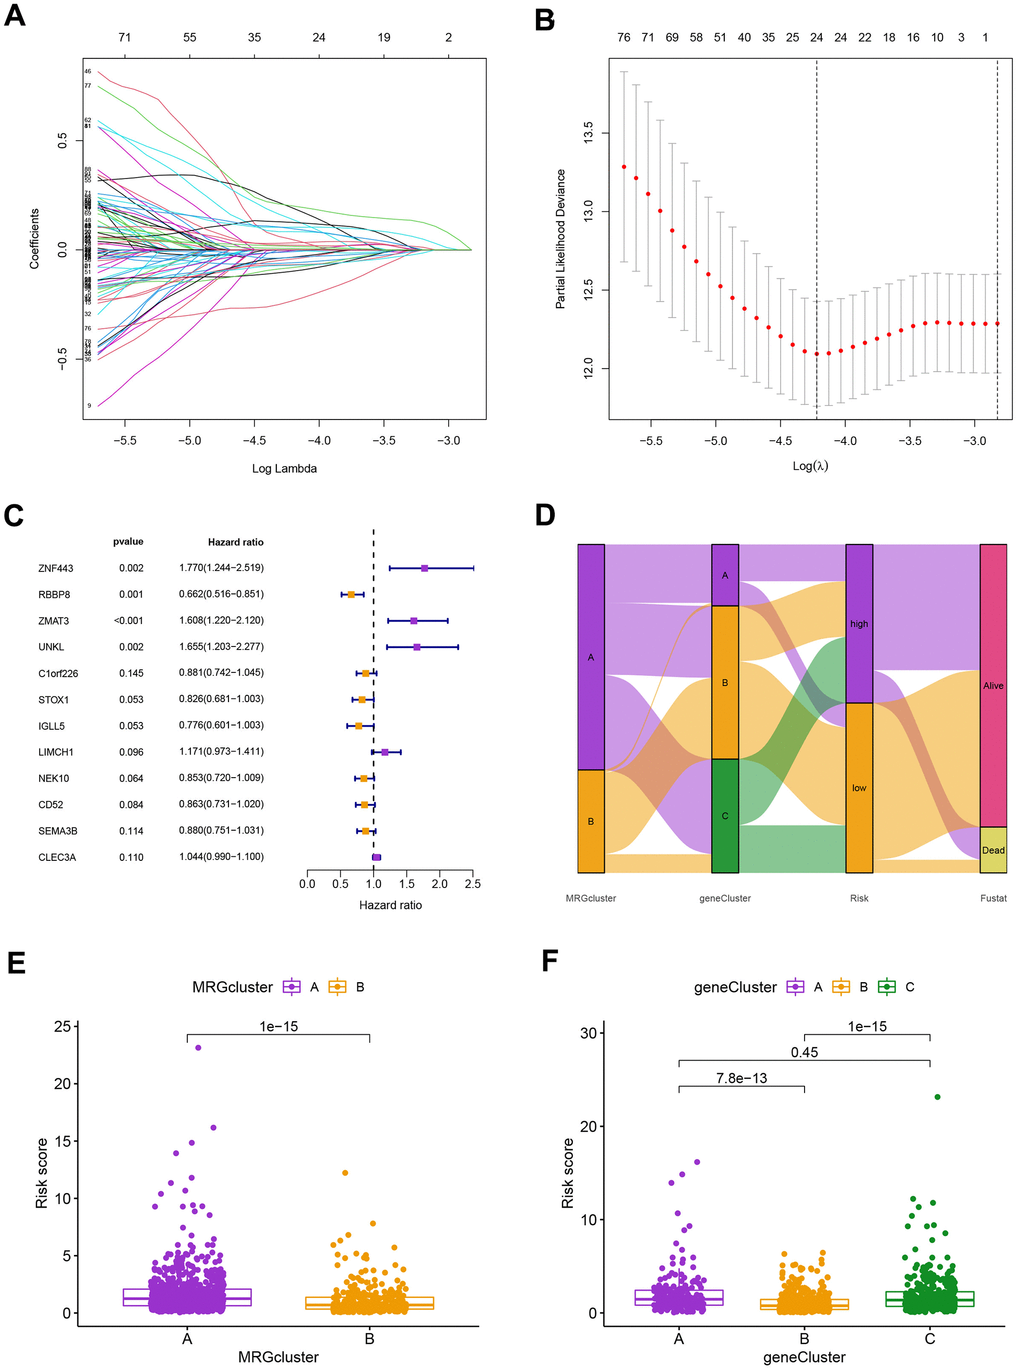
Figure 6.(A) The LASSO regression algorithm to screen candidate prognostic DEGs. (B) The partial likelihood deviance with changing of log(λ) in LASSO regression analysis. (C) The forest plot showing the relationship of prognostic-related DEGs with prognosis in BC patients. (D) The relationship between the MRG cluster, gene cluster, risk groups, and survival status was visualized using the Sankey diagram. (E, F) The distribution of risk scores for the two MRG clusters and three gene clusters, respectively.