Submit an Article
Navigate
Home
Editorial Board
Editorial Policies
Current Volume
Archive
Scientific Integrity
Publication Ethics Statements
Interviews with Outstanding Authors
Newsroom
Sponsored Conferences
Podcast
Contact
Special Collections
Submit an Article
Online ISSN: 1945-4589
Research Paper
|
Volume 16, Issue 10
|
pp. 8998–9022
Breast cancer clinical outcomes and tumor immune microenvironment: cross-dialogue of multiple epigenetic modification profiles
Back to article
Figure 5
(5 of 12)
−
100%
+
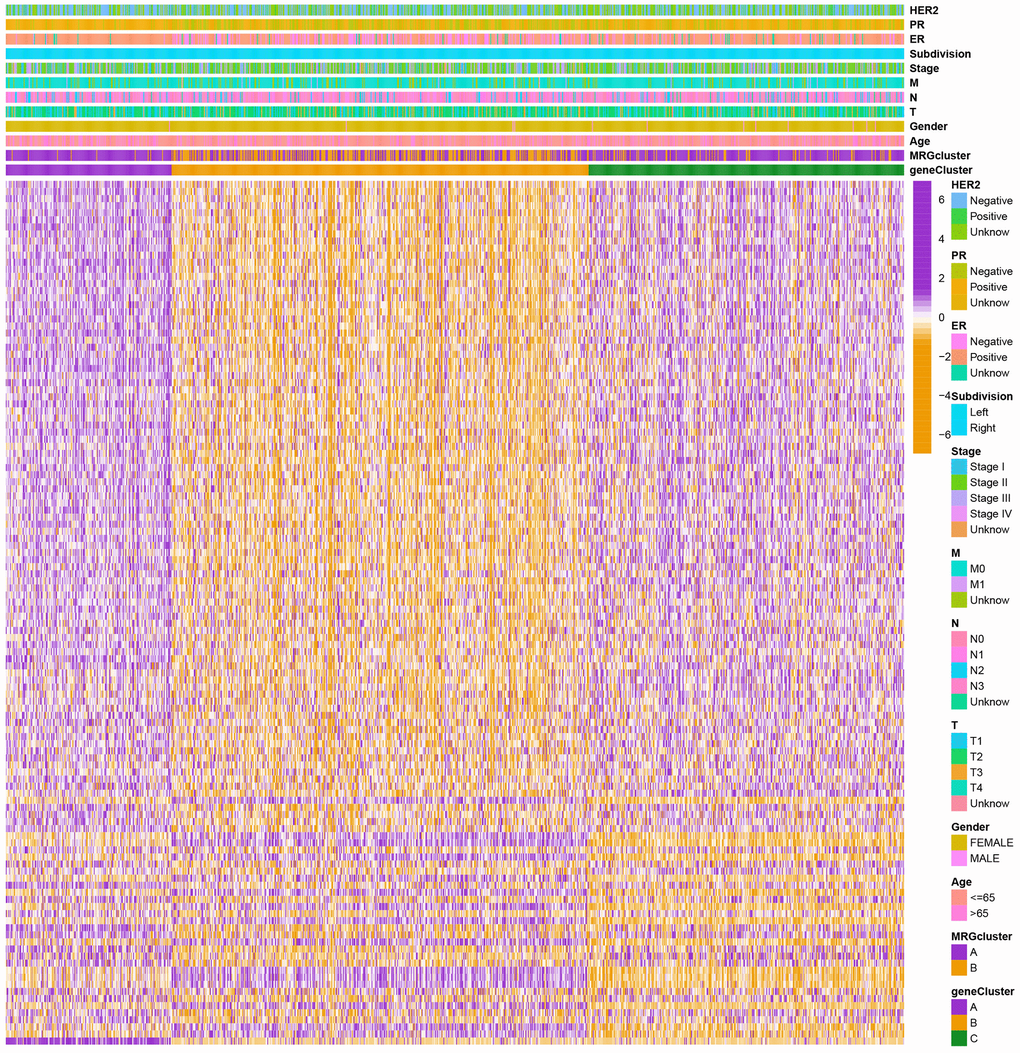
Figure 5.
Heatmap of the clinical features and gene expression levels between the three gene clusters.
Colors from orange to purple indicate the trend of gene expression levels from low to high.