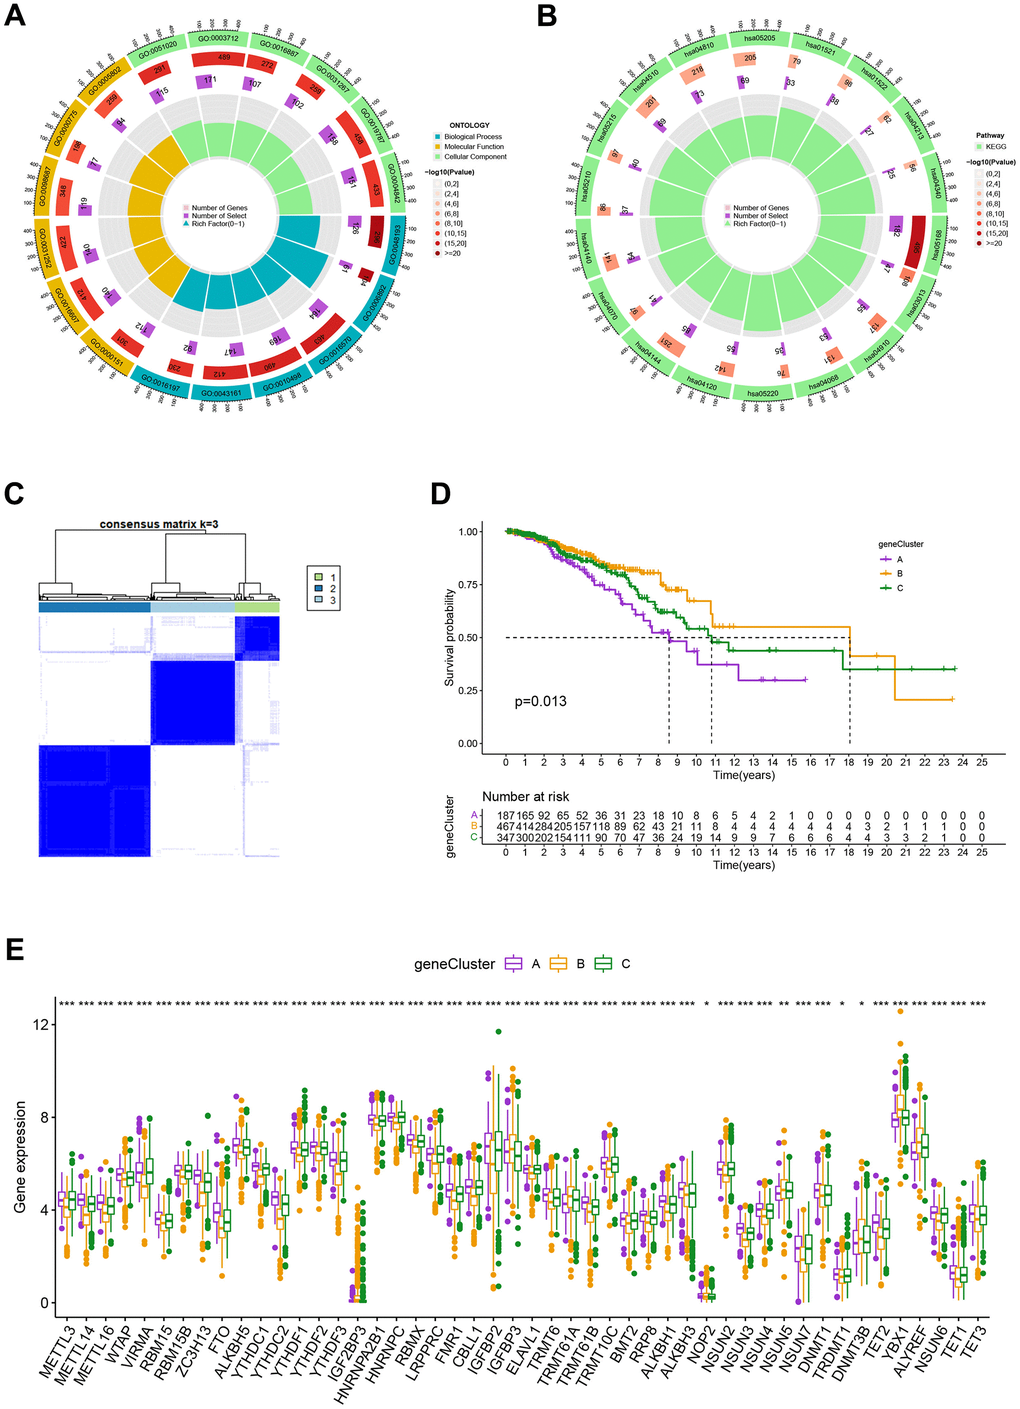
Figure 4.(A, B) GO and KEGG enrichment analyses. (C) Consensus matrix heatmap defining A, B and C gene clusters (k = 3). (D) Kaplan-Meier curves indicated that patients in gene cluster B had higher OS compared with patients in gene cluster A and C. P-values calculated by log-rank test. (E) The difference of gene expression levels between the three gene clusters. *P<0.05, **P<0.01, ***P<0.001.