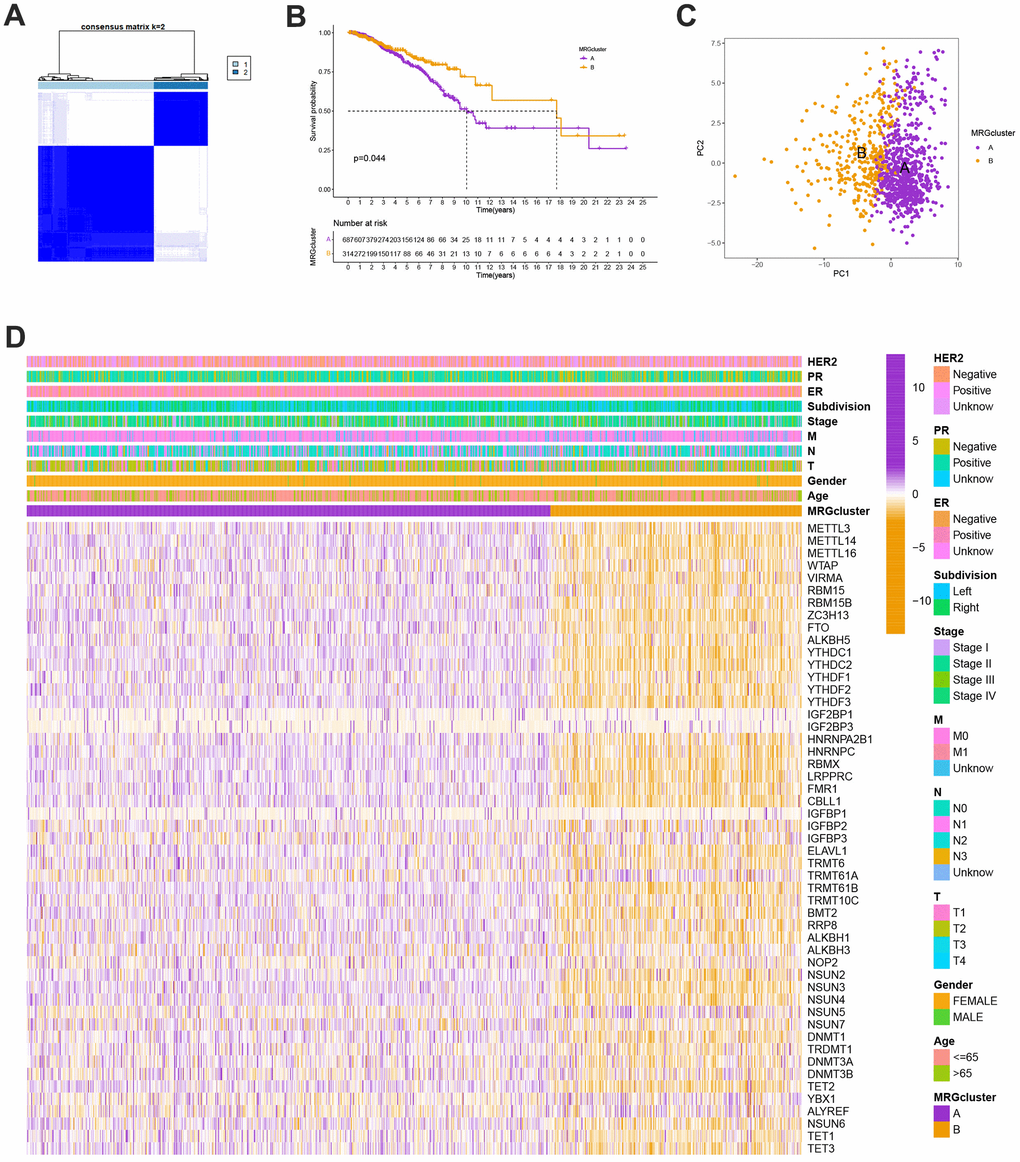
Figure 2.(A) Consensus matrix heatmap defining A and B MRG clusters (k = 2). (B) Kaplan-Meier curves indicated a shorter OS in patients with MRG cluster A than that in patients with MRG cluster B. P-values calculated by log-rank test. (C) The principal component analysis of A and B MRG clusters. (D) Heatmap of the clinical features and MRGs expression levels between the two MRG clusters. Colors from orange to purple indicate the trend of MRGs expression levels from low to high.