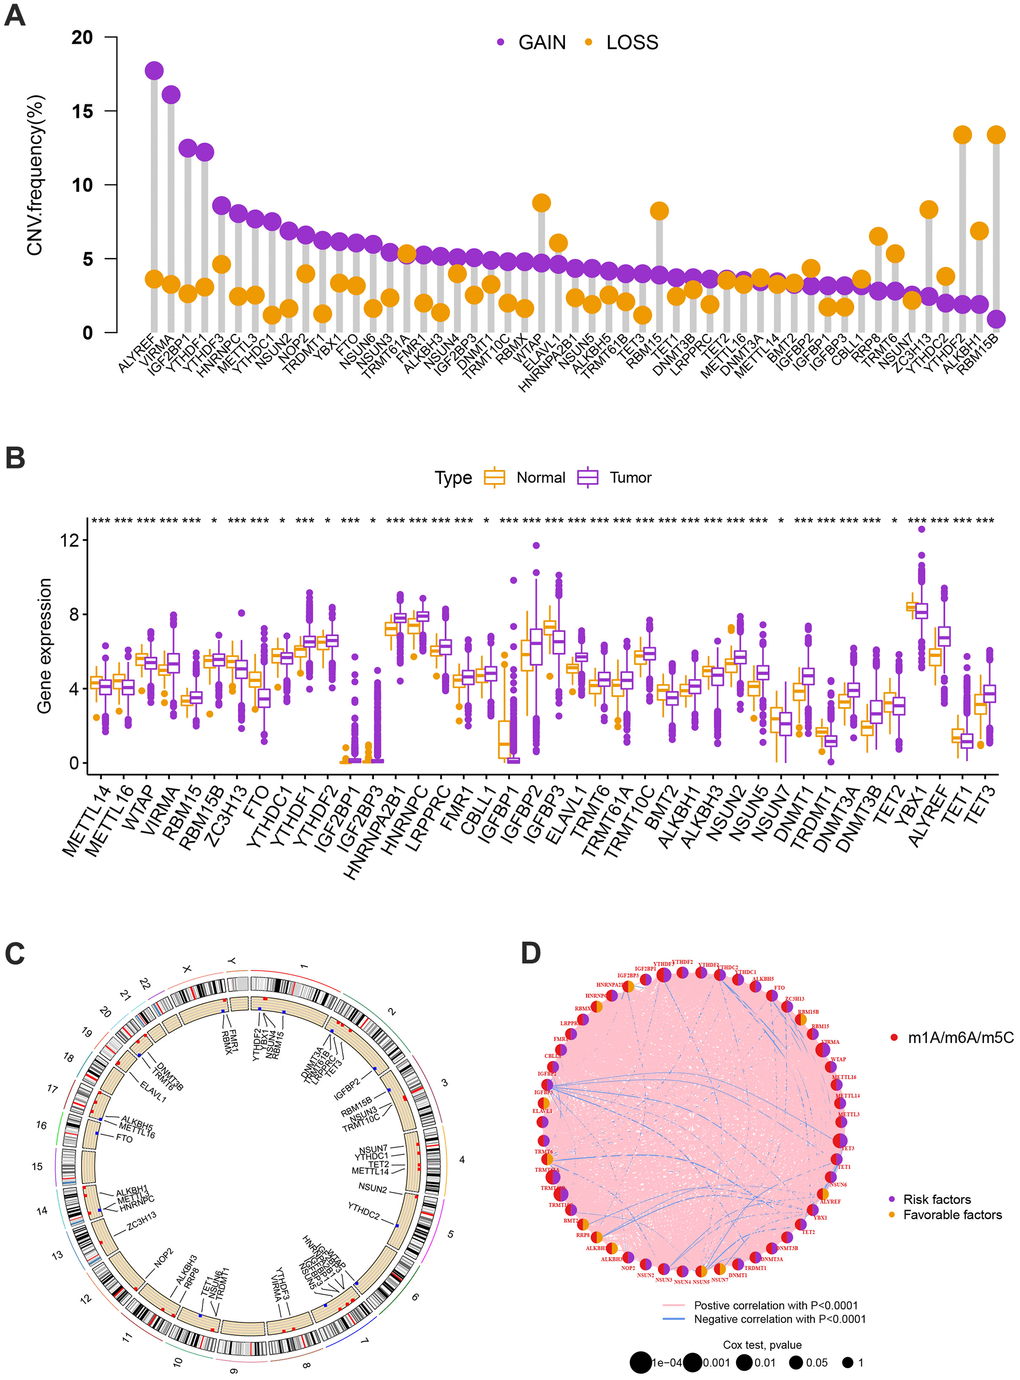
Figure 1.(A) The CNV of 57 MRGs. (B) Expression distributions of differentially expressed MRGs between normal and BC tissues. Orange: the normal breast tissues; purple: breast cancer tissues. (C) The positions of the CNV alterations on their respective chromosomes for these MRGs. (D) The overall group of MRG interactions, regulatory factor connectivity, and value of prognosis in BC patients were identified in the network. The circle size reflects the P-value. The purple circle reflects the risk factors while the orange circle reflects the favorable factors. The pink line is represented by positive correlation with P<0.0001 while the blue line is represented by negative correlation with P<0.0001.