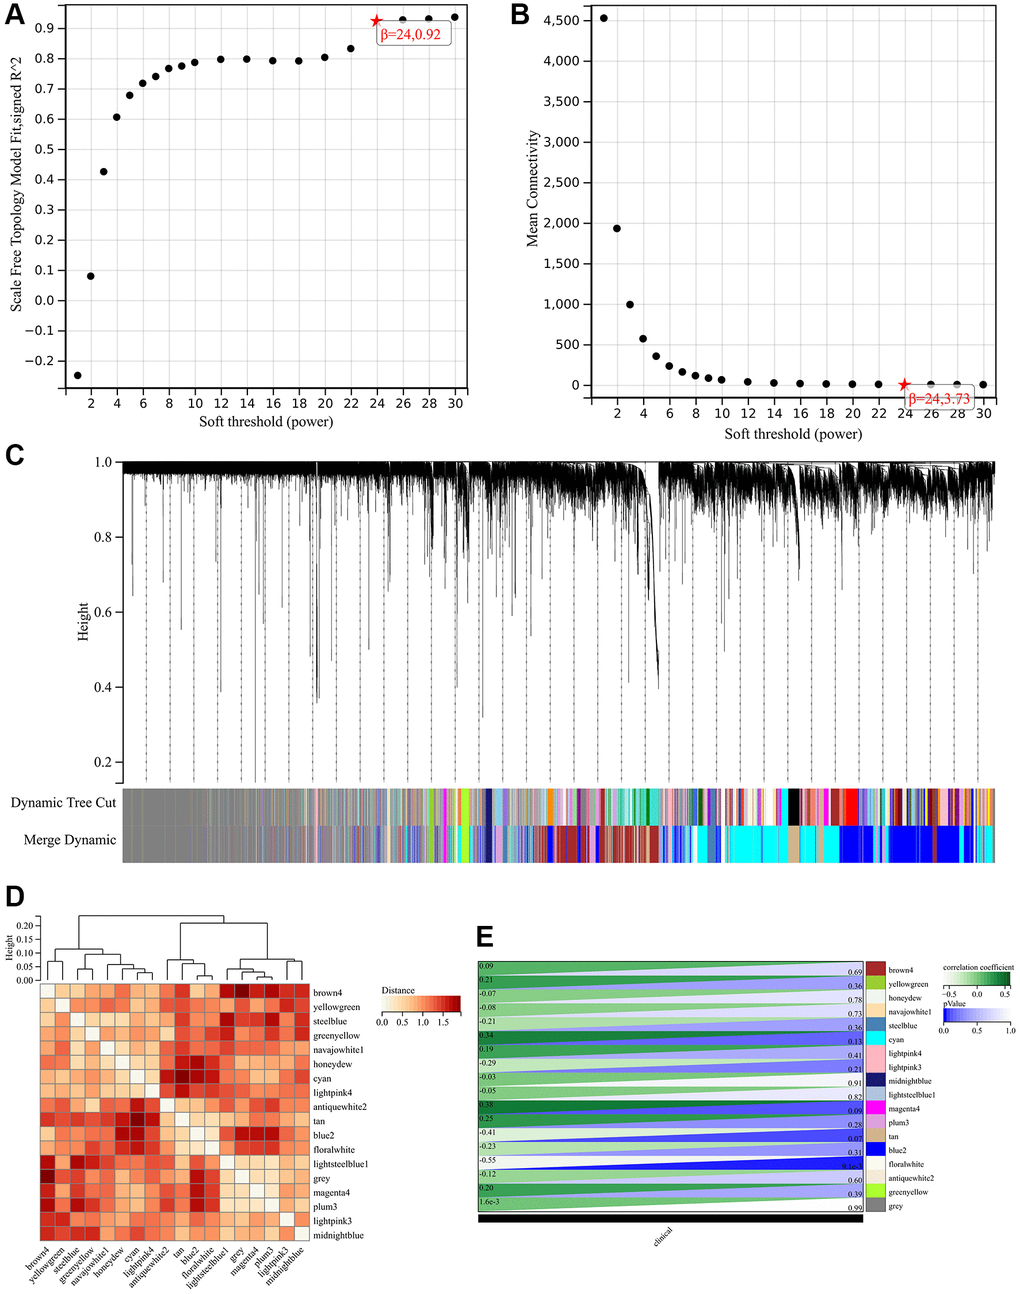
Figure 5.Weighted gene co-expression network analysis to identify hub genes of the hypertension. (A, B) Soft threshold (power) and the β = 24. (C) Dynamic tree cut. (D) The correlation among the different modules. (E) The relationships between hypertension and significant modules.