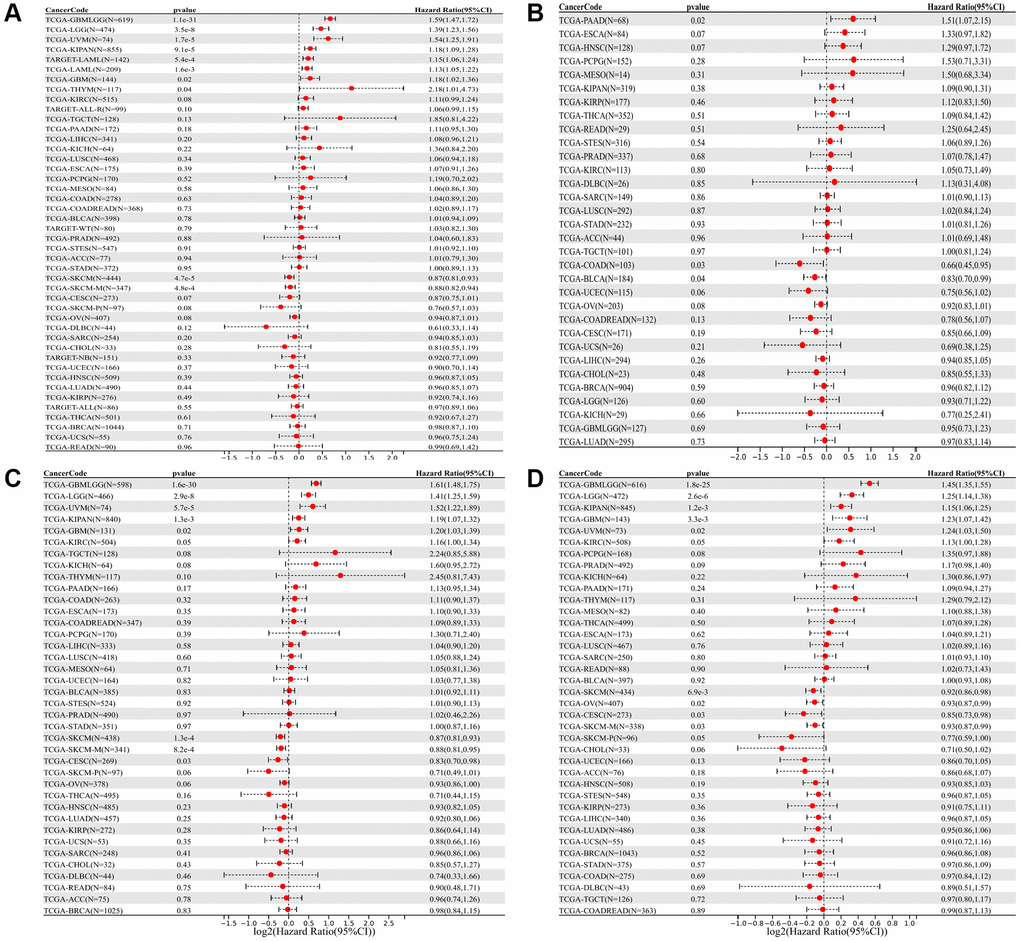
Figure 2.Forest plot of the relationship between SLAMF8 expression and OS (A), DFI (B), DSS (C), and PFI (D) time in days, utilizing univariate survival analysis, across 33 types of tumors.
Figure 2 — SLAMF8 can predict prognosis of pan-cancer and the immunotherapy response effectivity of gastric cancer | Aging