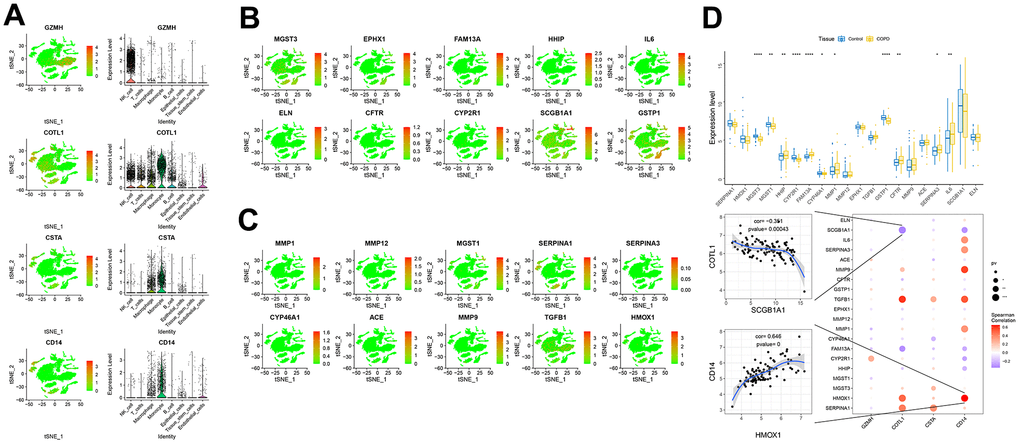
Figure 7.Expression of key genes in single cells. (A–C) Expression of key genes and disease-causing genes in cells. (D) The upper panel represented differences in the expression of disease-regulated genes, with control patients in blue and disease patients in yellow. The lower panel represented the pearson correlation analysis between key genes and disease genes. Blue color represents negative correlation and red color represents positive correlation.