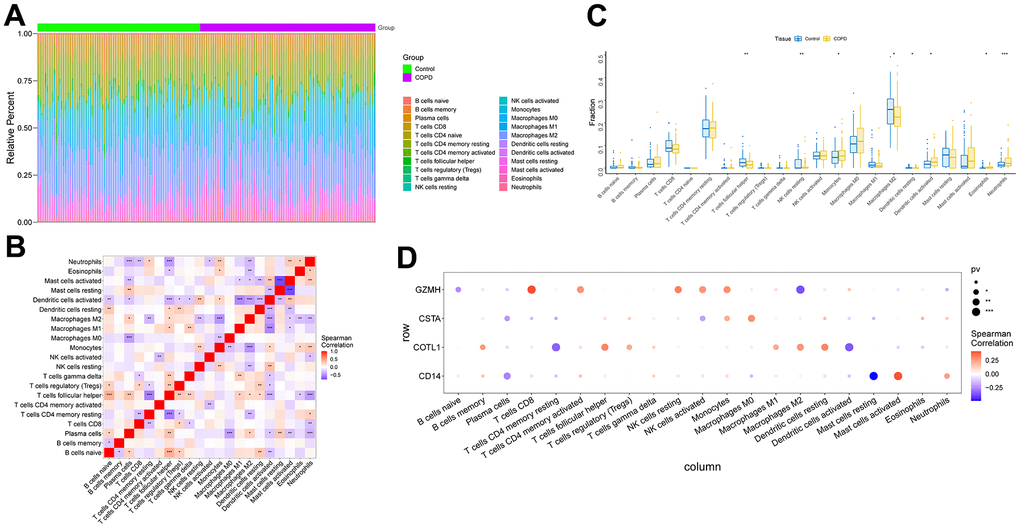
Figure 5.Analysis of immune cell infiltration in COPD samples. (A) Relative percentages of immune cell subpopulations. (B) Correlation between immune cell subpopulations, where red represents positive correlation and blue represents negative correlation. (C) Differences in immune cell content between COPD and control samples. (D) Correlation between 4 key genes and immune cells. Where red represents a positive correlation and blue represents a negative correlation, the larger black solid circle represents a more statistically significant difference.