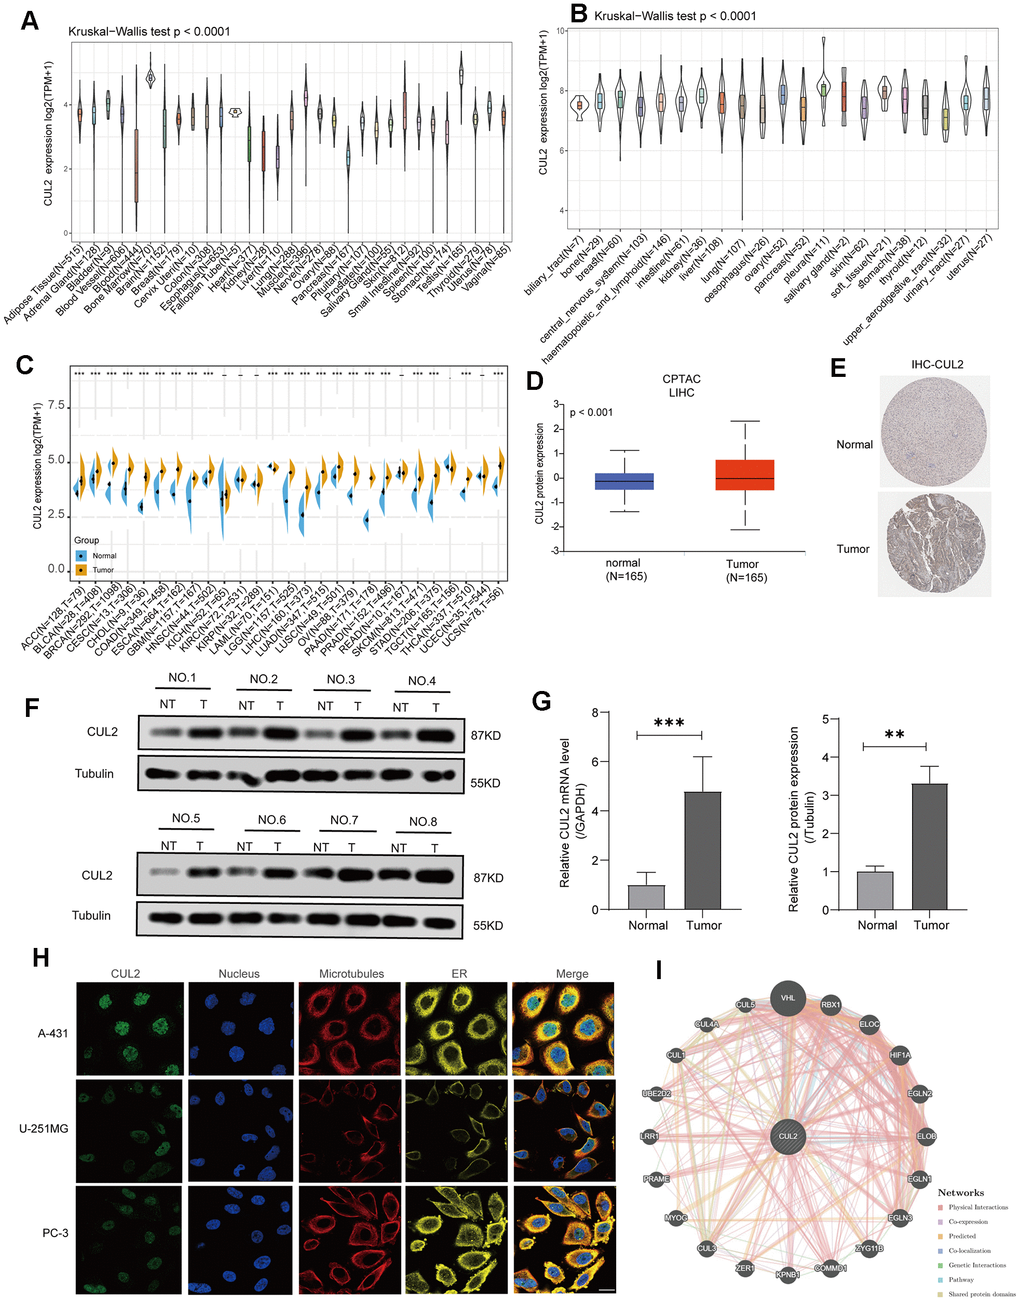
Figure 2.CUL2 expression analysis in various cancers. (A) The level of CUL2 expression in normal tissues. (B) The level of the CUL2 in tumor cell lines. (C) A comparative analysis of CUL2 expression levels between various tumors and healthy tissues was conducted using TCGA and GTEx databases data. The box plot data was provided, and Log2 (TPM+1) was used to represent the log scale. (D) The CUL2 protein expression in LIHC is based on the CPTAC website. (E) Representative images from the HPA database depict immunohistochemical staining analysis of CUL2 in LIHC tissue and adjacent normal tissue are displayed. (F, G) The protein and mRNA levels of CUL2 were analyzed via Western blotting and qRT-PCR in paired LIHC tissues and adjacent normal tissues. (H) The immunofluorescence images showed the distribution of CUL2 in the A-431, U-251MG, and PC-3 cell lines. (I) The protein-protein interaction (PPI) network presents the proteins interacting with CUL2. All data are presented as the mean ± SD of three independent experiments. *p < 0.05, ** p < 0.01, *** p < 0.001, ns, no significance.