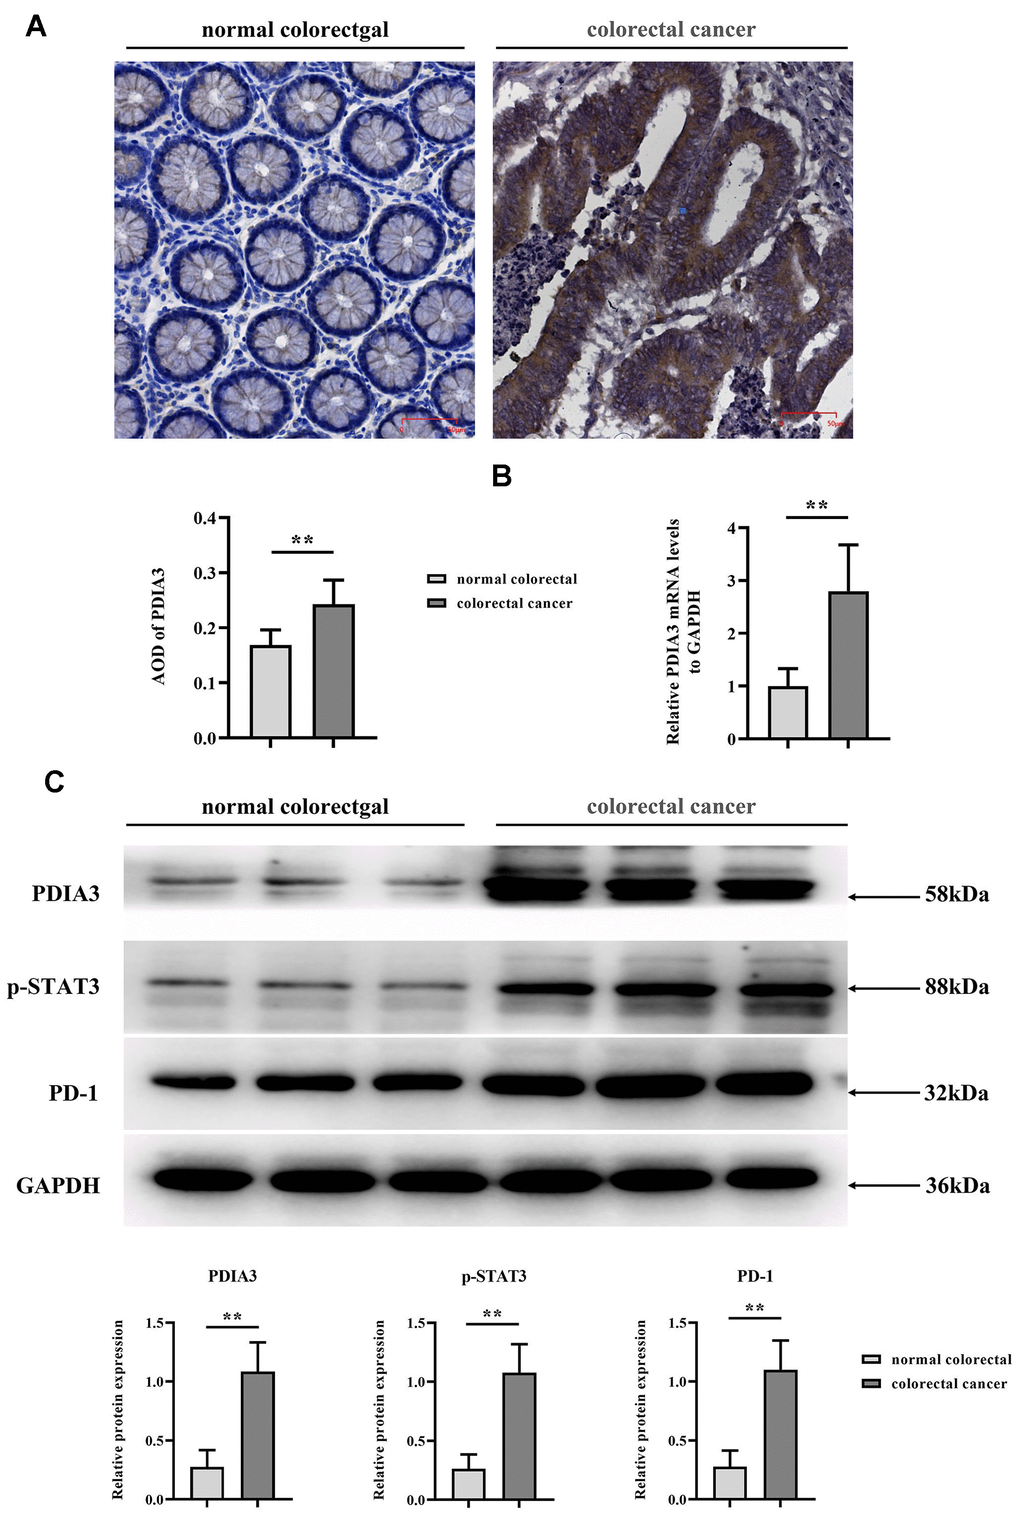
Figure 2.Elevated levels of PDIA3, phosphorylated STAT3 (p-STAT3), and PD-1 are present in CRC tissues. (A) Immunohistochemical assessment of PDIA3 protein in CRC and adjacent normative tissue. Statistical evaluation via T-test* *P < 0.01 versus normative control (n=96 pairs). (B) RT-qPCR quantification of PDIA3 mRNA in CRC and normative tissue (n=96 pairs). Statistical evaluation via T-test,* *P < 0.01 versus normative control. (C) Total protein isolation from tumor specimens with RIPA buffer, subsequently quantified via the BCA assay. Relative protein expression levels of PDIA3, p-STAT3, and PD-1 were determined after densitometric analysis from three independent samples. Statistical evaluation via T-test, * *P < 0.01 versus normative control.