Submit an Article
Navigate
Home
Editorial Board
Editorial Policies
Current Volume
Archive
Scientific Integrity
Publication Ethics Statements
Interviews with Outstanding Authors
Newsroom
Sponsored Conferences
Podcast
Contact
Special Collections
Submit an Article
Online ISSN: 1945-4589
Research Paper
|
Volume 16, Issue 10
|
pp. 8843–8865
Molecular mechanism of Danxiong Tongmai Granules in treatment of coronary heart disease
Back to article
Figure 4
(4 of 18)
−
100%
+
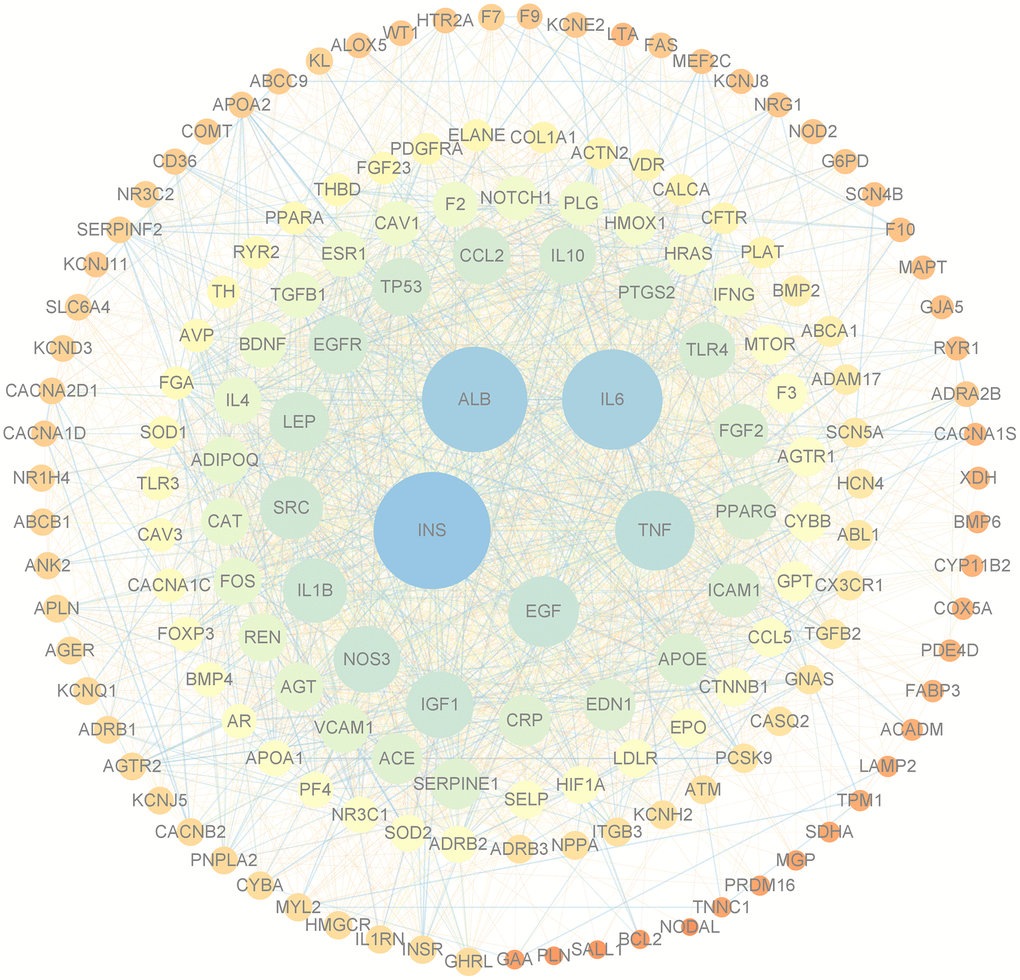
Figure 4.
PPI network of targets of DXTMG and CHD.
(The sizes and colors of the nodes and lines are illustrated from large to small and blue to red in descending order of degree values).