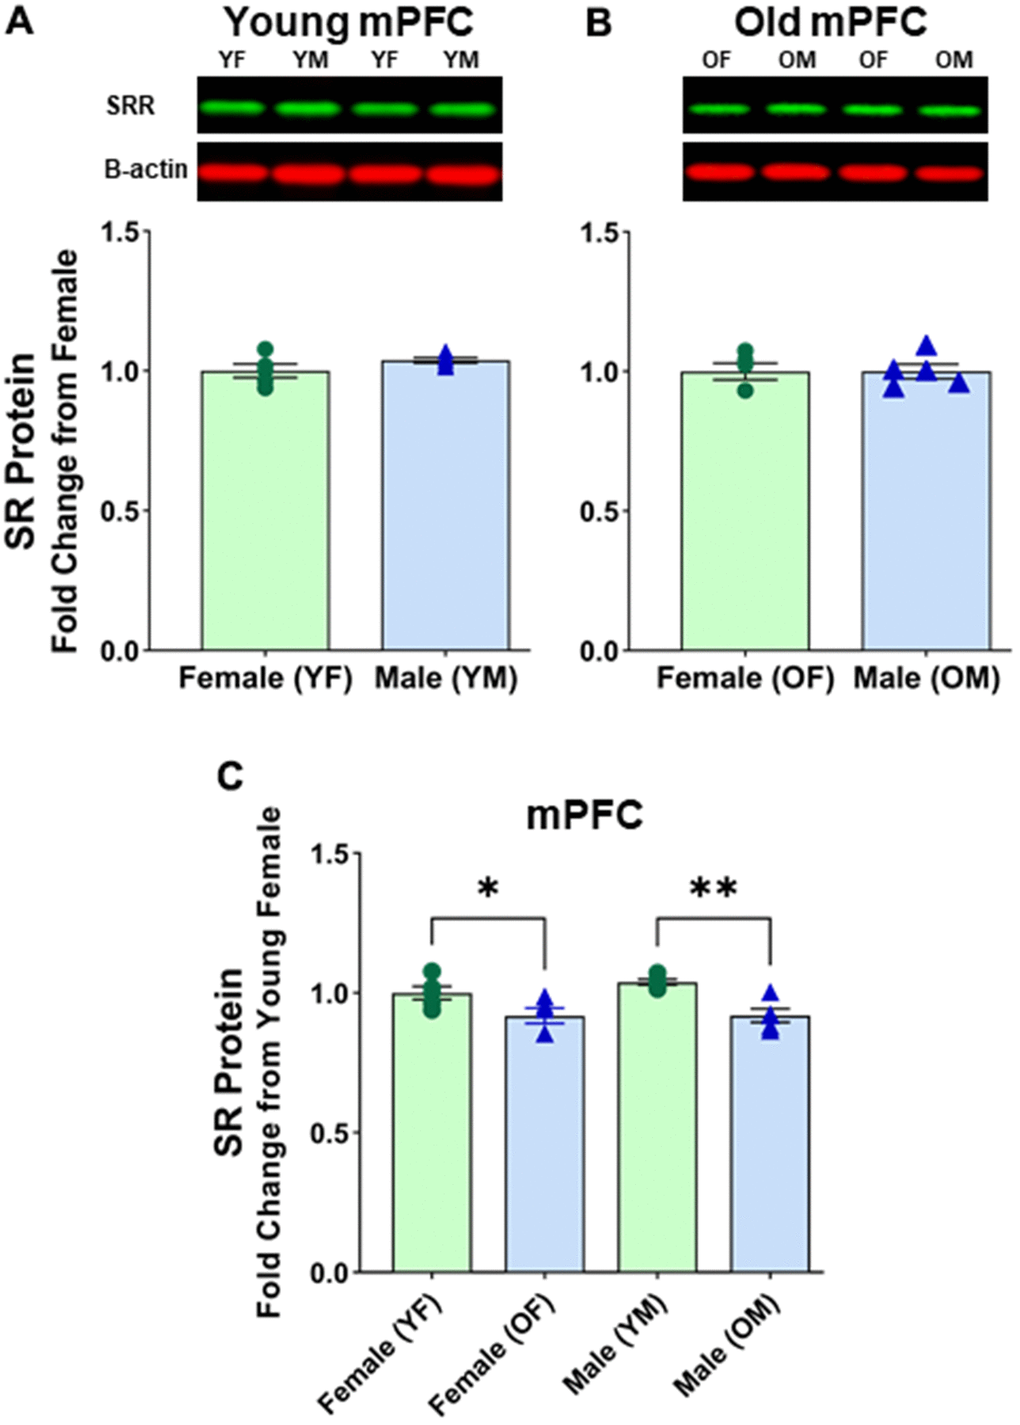
Figure 4.No sex differences in protein levels of serine racemase in the mPFC were observed. Western blots demonstrating expression of SR in (A) young female vs young male, and (B) old female vs old male. For A and B, fold changes were calculated from females for each age group. (C) depicts fold change of protein levels adjusted from young females. Bar graphs depict quantitative analysis of immunoreactivity for SR when normalized to total protein (see supplementary figure 3). The signal for B-actin is shown here for visual comparison only.