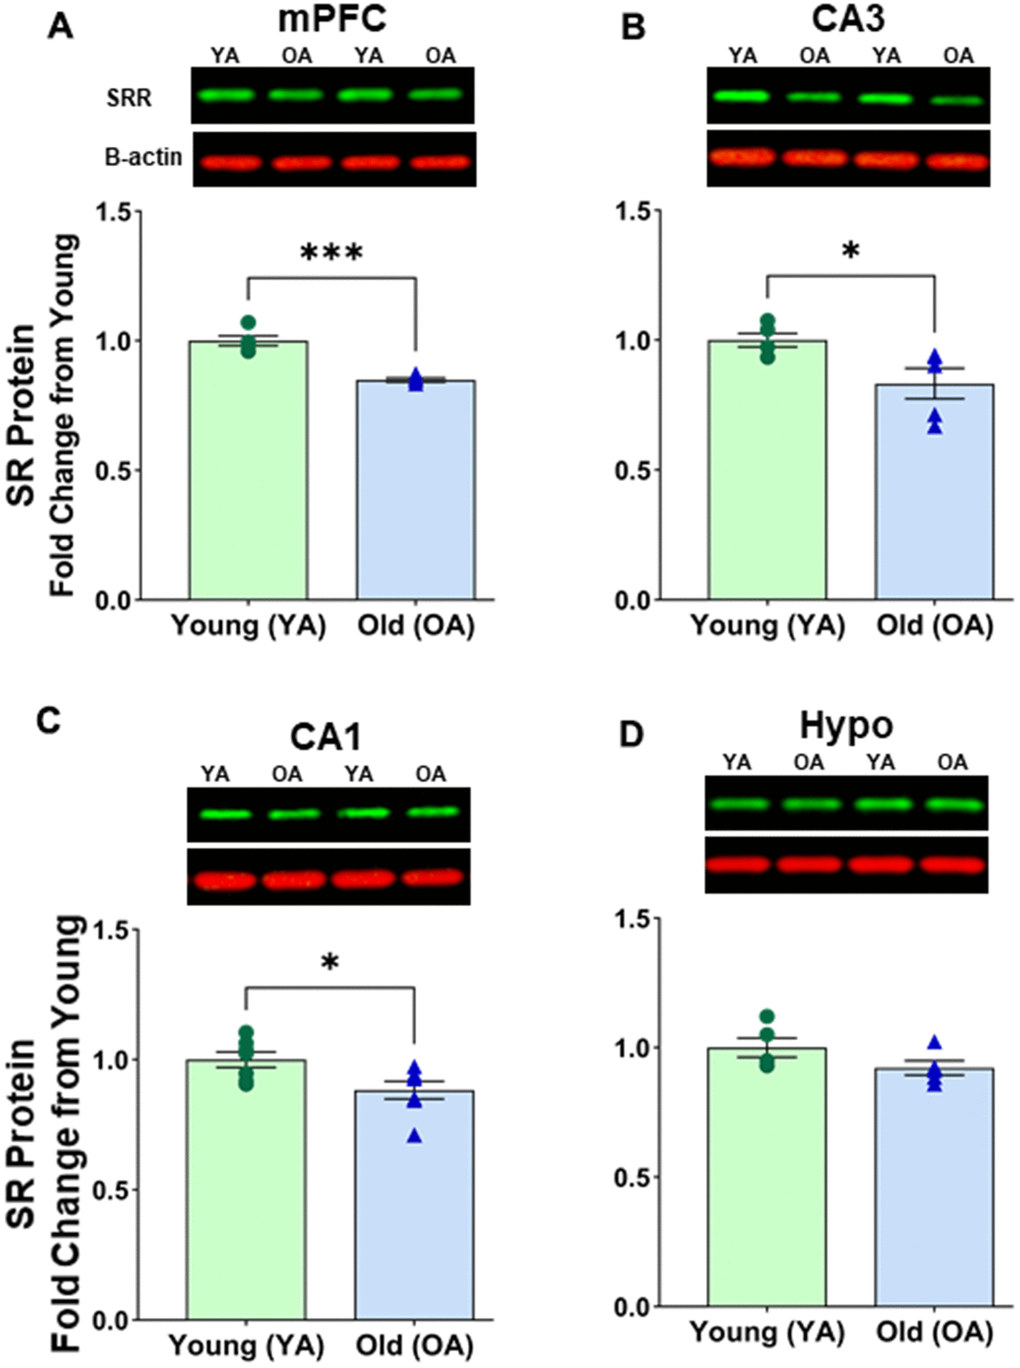
Figure 3.Protein levels of serine racemase were reduced with age in select areas of the female Fisher 344 rat brain. Western blots demonstrating expression of SR in (A) medial prefrontal cortex (mPFC) (B) CA3 subfield of the hippocampus, (C) CA1 subfield of the hippocampus, (D) hypothalamus (Hypo). Bar graphs illustrating the quantitative analysis of immunoreactivity for SR when normalized to total protein. B-actin is shown for visual comparison only. Blots for total protein can be seen in Supplementary Figure 2. Asterisks for p-values indicate significance (*p<0.05, ****p<0.0001).
Figure 3 — Serine racemase expression profile in the prefrontal cortex and hippocampal subregions during aging in male and female rats | Aging