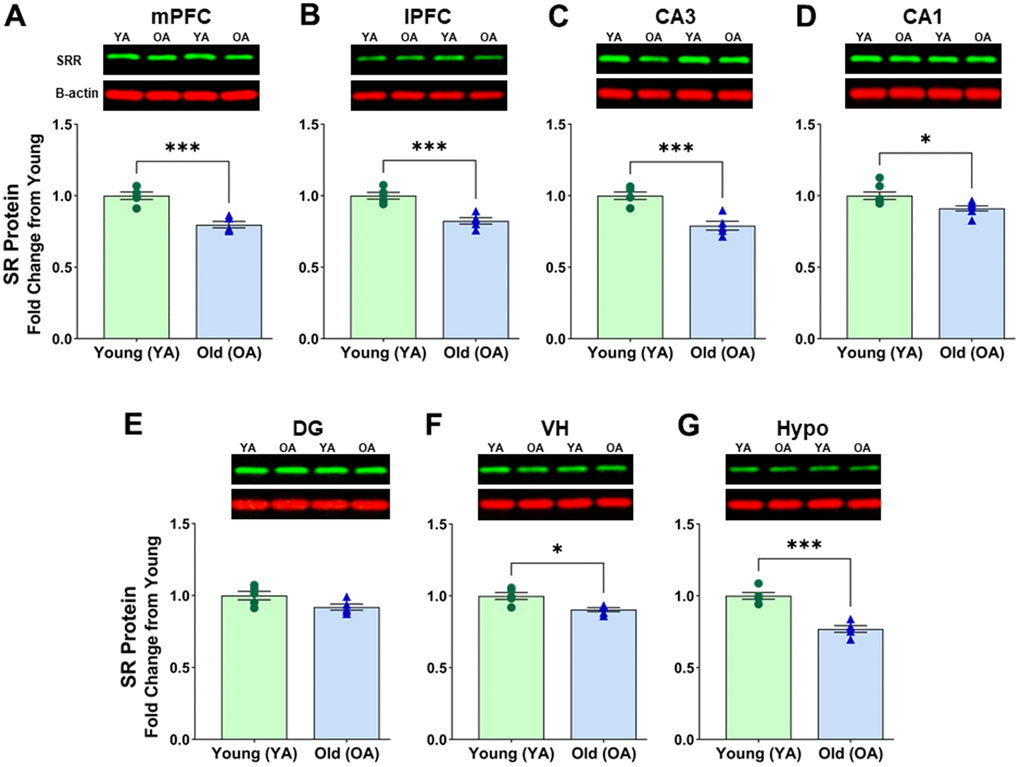
Figure 1.Protein levels of serine racemase were decreased with age in the male F344 rat brain. Western blots demonstrating expression of SR in (A) medial prefrontal cortex (mPFC), (B) lateral prefrontal cortex (lPFC), (C) CA3 subfield of the hippocampus, (D) CA1 subfield of the hippocampus, (E) Dentate gyrus (DG) subfield of the hippocampus, (F) ventral hippocampus (VH), (G) hypothalamus (Hypo). Bar graphs illustrate the quantitative analysis of immunoreactivity for SR when normalized to total protein. B-actin is shown for visual comparison only. Blots for total protein can be seen in Supplementary Figure 1. Asterisks for p-values indicate significance (*p<0.05, **p<0.005, ***p<0.0005).