Submit an Article
Navigate
Home
Editorial Board
Editorial Policies
Current Volume
Archive
Scientific Integrity
Publication Ethics Statements
Interviews with Outstanding Authors
Newsroom
Sponsored Conferences
Podcast
Contact
Special Collections
Submit an Article
Online ISSN: 1945-4589
Research Paper
|
Volume 16, Issue 10
|
pp. 8822–8842
Inflammation-based lung adenocarcinoma molecular subtype identification and construction of an inflammation-related signature with bulk and single-cell RNA-seq data
Back to article
Figure 6
(6 of 10)
−
100%
+
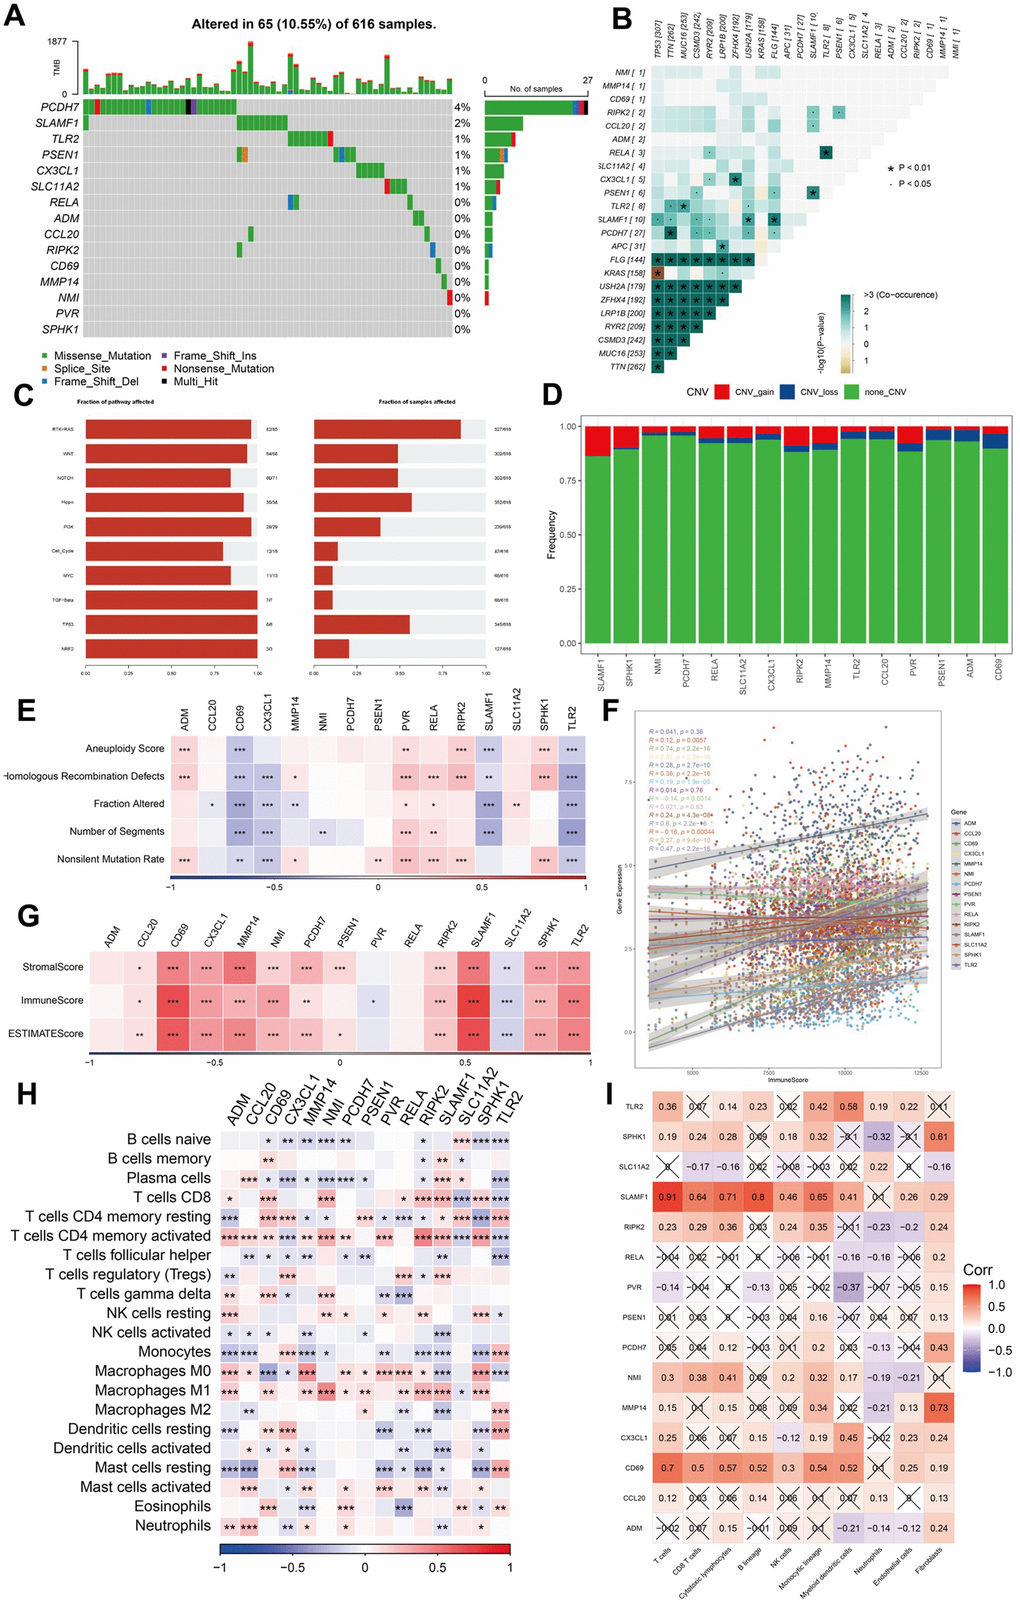
Figure 6.
Analysis of mutation, immunity, and hub gene pathways.
(
A
–
E
) The correlation between the mutation status and hub genes. (
F
–
I
) The features of immune cells and immune score based on the 15 hub genes. ***P <0.001, ****P < 0.0001.