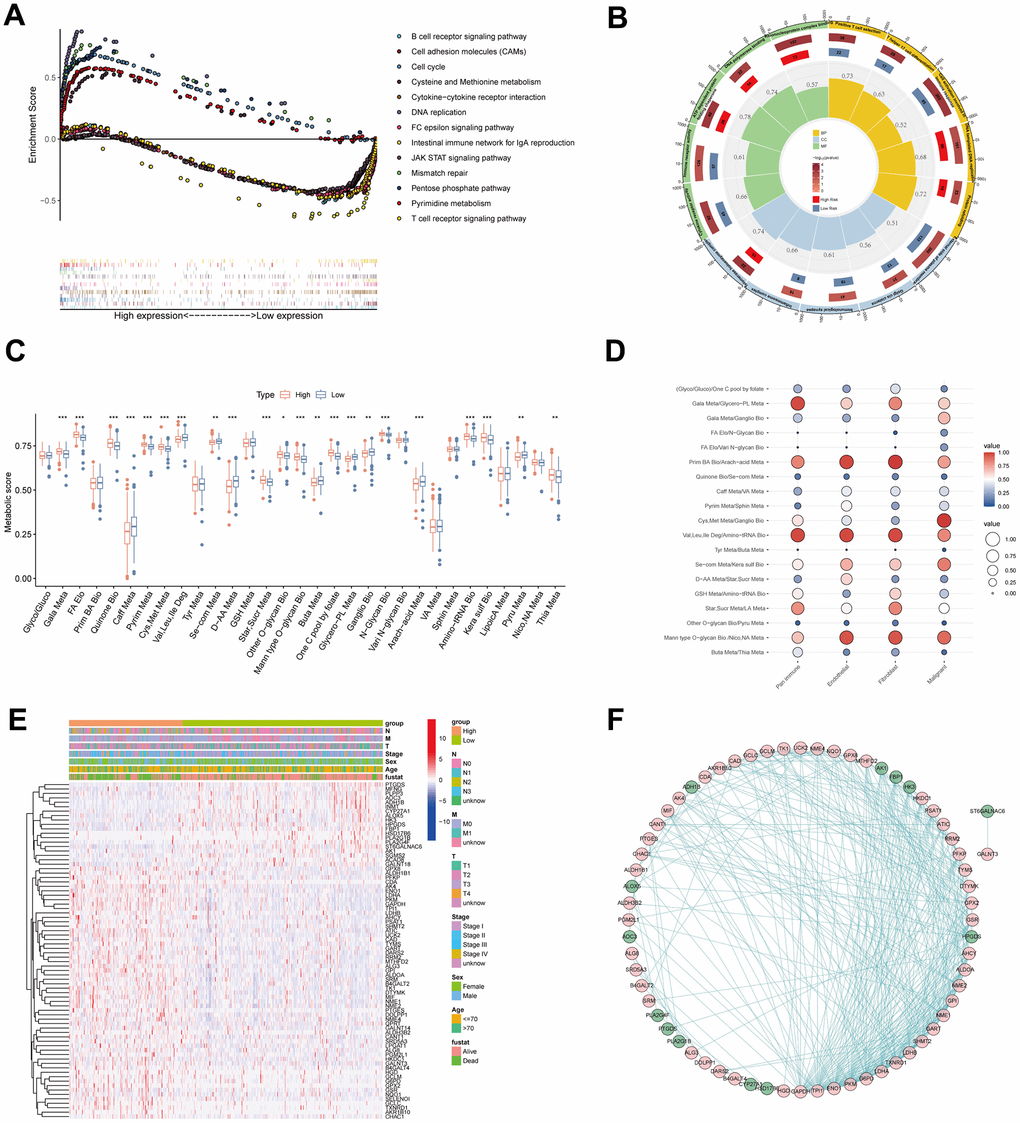
Figure 6.Pathway enrichment and function annotation of the high- and low-risk groups. (A) Kyoto Encyclopedia of Genes and Genomes (KEGG) pathway analyses between the high- and low-risk groups. (B) Gene Ontology (GO) between the high- and low-risk groups. (C) The differences of 31 metabolic pathways scores between the high- and low-risk groups. (D) The bubble diagram was drawn by the average of 19 metabolic pathway pairs in pan-immune cells, endothelial cells, fibroblasts, and malignant cells. (E) The differences of genes in 19 metabolic pathway pairs between the high- and low-risk groups. Pathological stage, sex, age, and survival status used as patients’ annotation. (F) The protein-protein interaction network by STRING website and the software Cytoscape v3.9.1. *P < 0.05, **P < 0.01, ***P < 0.001.