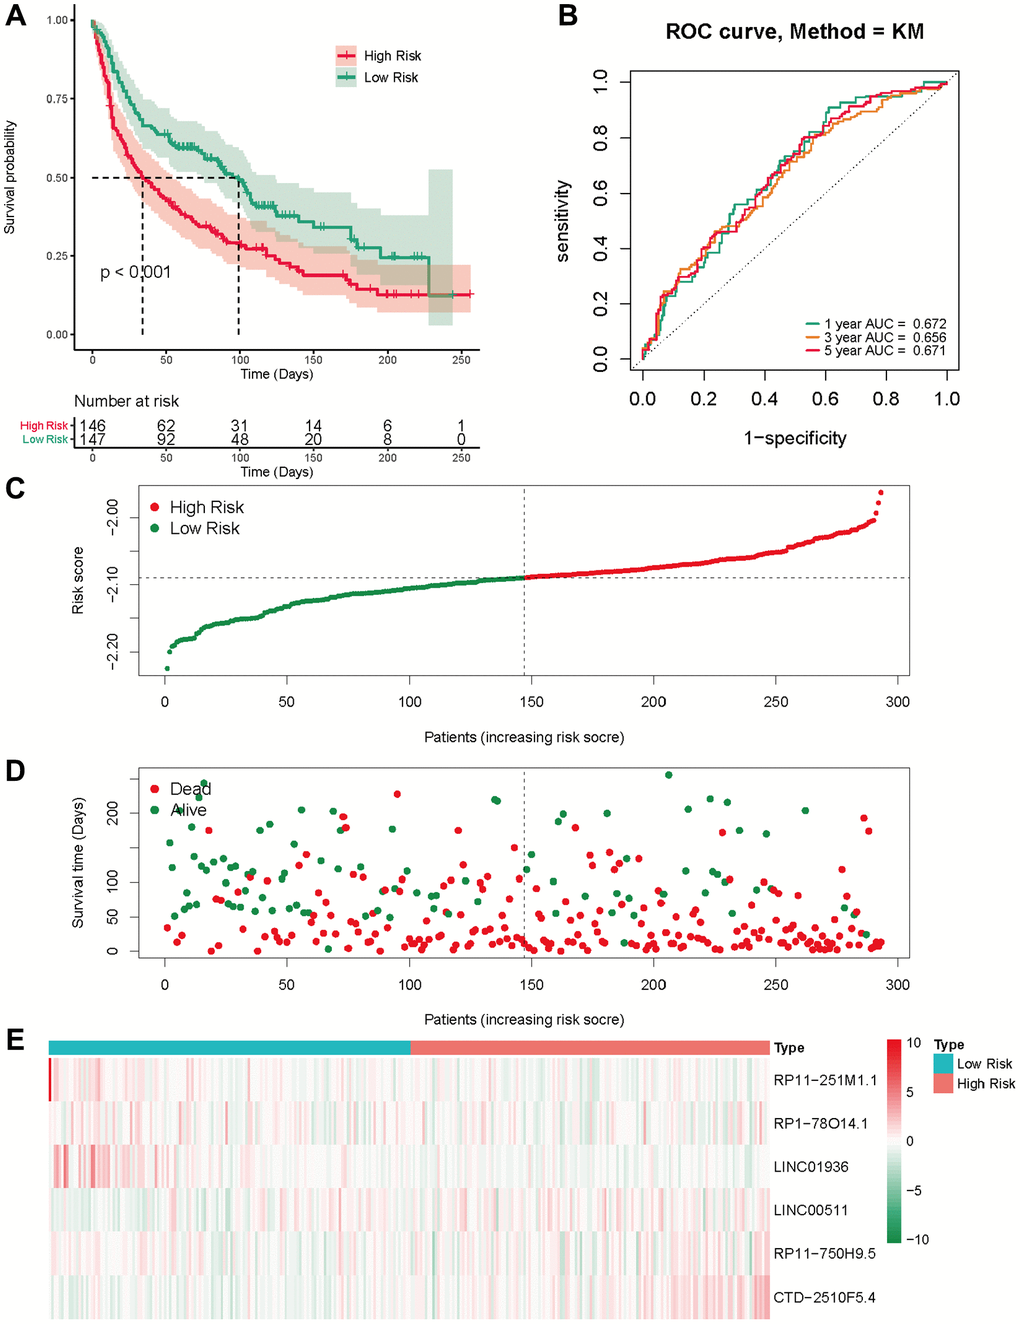
Figure 5.External validation of the risk score in the GSE30219 cohort. (A) The Kaplan-Meier survival analysis; (B) The time-dependent ROC analysis for the risk score in predicting the OS of patients in the GSE30219 cohort; (C, D) The risk score distribution and survival status of patients in the GSE30219 cohort; (E) The heatmap analysis.