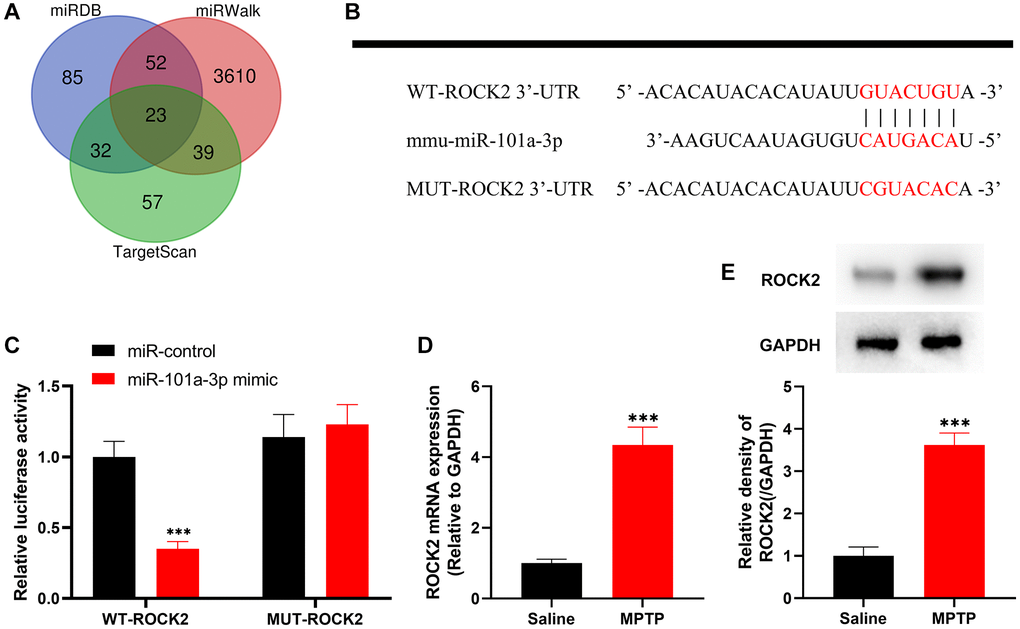
Figure 2.ROCK2 is the target of miR-101a-3p. (A) The Venn diagram shows the results of the miRDB, miRWalk and TargetScan databases to predict possible downstream targets of mmu-miR-101a-3p. (B) Bioinformatics analysis was conducted to predict the binding site between miR-101a-3p and ROCK2, and WT-ROCK2 and MUT-ROCK2 luciferase reporter gene vectors were constructed. (C) 293T cells were co-transfected with miR-101a-3p mimic or miR-control and WT-ROCK2 or MUT-ROCK2. After 48 h, the luciferase activity of each group of cells was determined. (D) ROCK2 mRNA expression levels of the mice in the normal saline group and MPTP group were detected by qRT-PCR. (E) Western blot was performed to detect ROCK2 protein expression level in the normal saline group and MPTP group. ***P < 0.001.