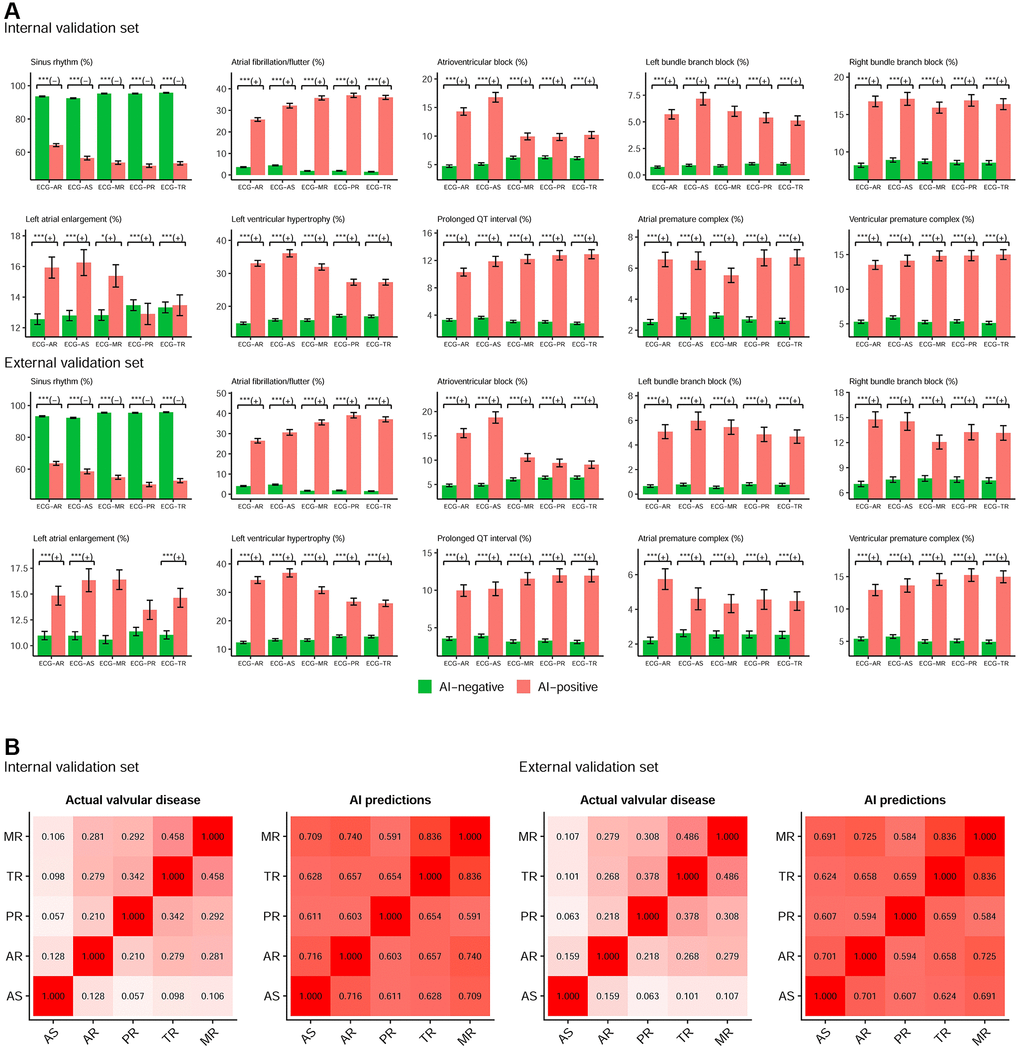
Figure 2.The components of AI predictions for detecting each valvular disease. (A) Relationship between ECG-screened valvular diseases and ECG rhythms. The plots display two groups, positive (AI-positive) and negative (AI-negative) findings, by the ECG networks using ECG alone. Sinus rhythm is associated with AI-negative (green bar), and other abnormal rhythms are associated with AI-positive (red bar). Abbreviations: *p < 0.05; **p < 0.01; ***p < 0.001. The +/− demonstrates the positive/negative relationship. (B) The relationship between each valvular disease in actual status and prediction. The values in each cell are the Spearman correlation coefficients.