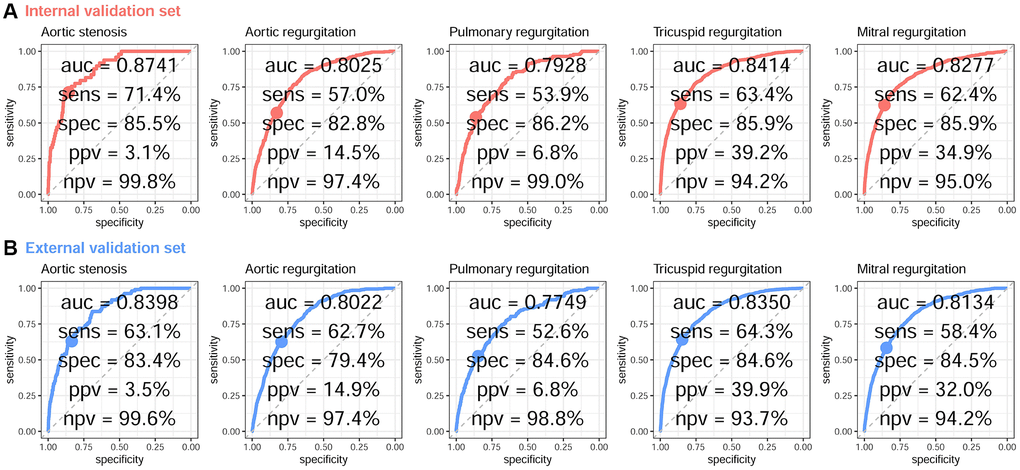
Figure 1.ROC curve analysis for VHD from a DLM based on age, sex, and ECG voltage–time traces. The receiver operating characteristic (ROC) curve (x-axis = specificity and y-axis = sensitivity) and area under the ROC curve (AUC) were calculated using the internal validation set (A) and external validation set (B). The operating point was selected based on the maximum Youden’s index in the tuning set, which was used for calculating the corresponding sensitivities and specificities in the two validation sets.