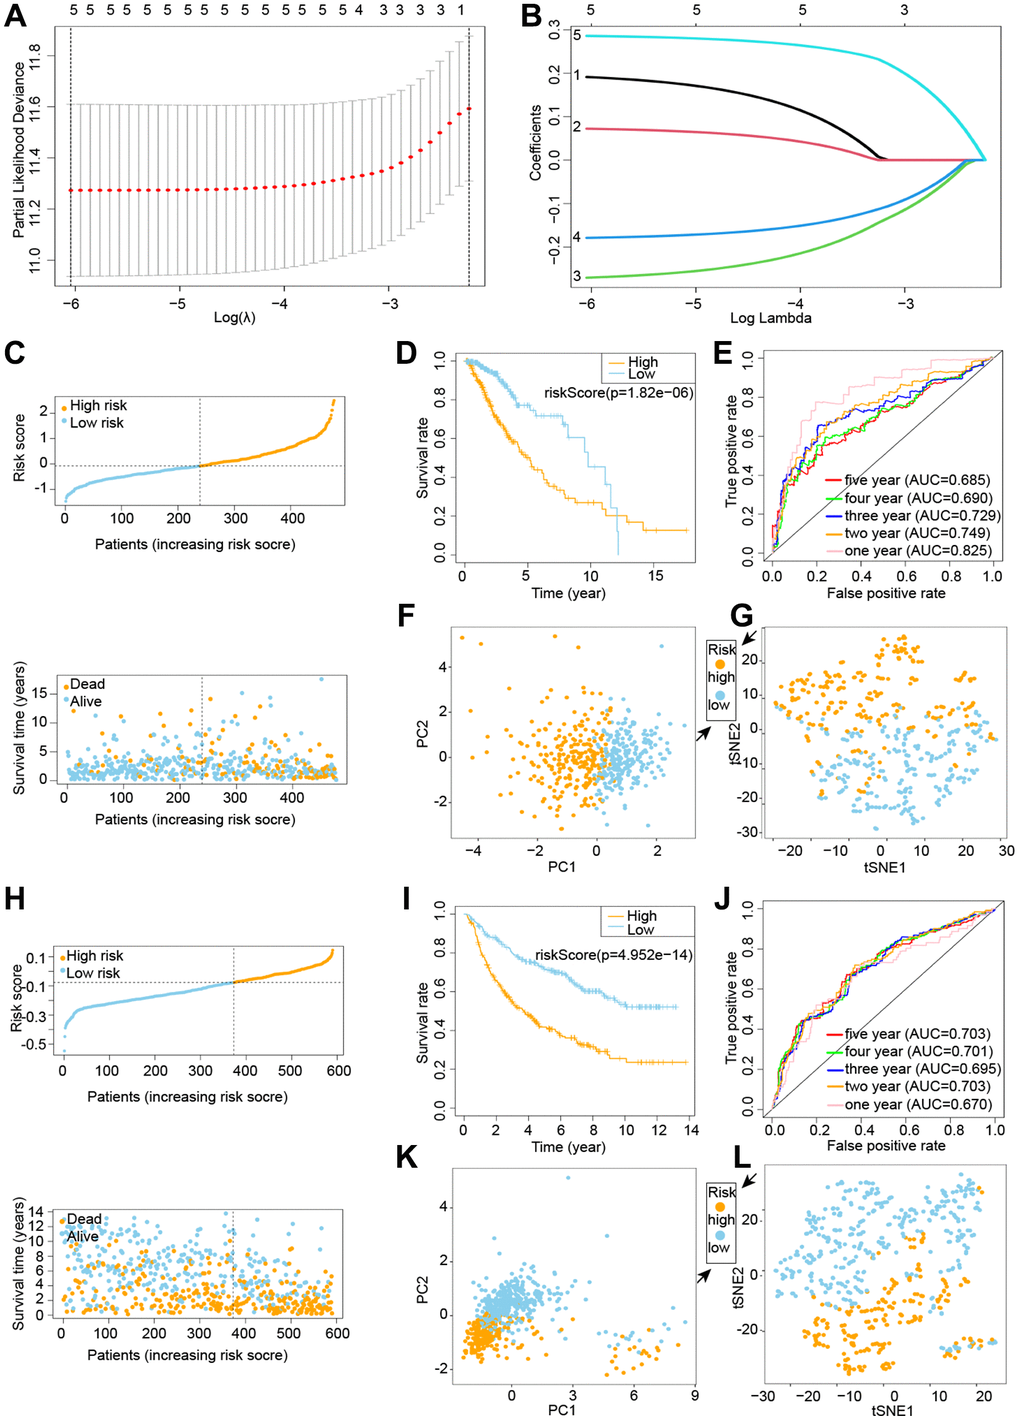
Figure 2.Building and testing a cuproptosis prognostic model. C-G denotes the TCGA cohort, whereas H-L denotes the CGGA cohort. (A, B) Visualization of LASSO regression. (C) Risk survival status plot. (D) Kaplan-Meier curve result. (E) The AUC of the prediction of 1, 2, 3, 4, 5-year survival rate of LGG. (F) PCA plot. (G) t-SNE plot. (H) LASSO regression visualization. (I) The outcome of the Kaplan-Meier curve. (J) The AUC for predicting LGG survival rates of 1, 2, 3, 4, and 5 years. (K) PCA plot. (L) t-SNE plot.