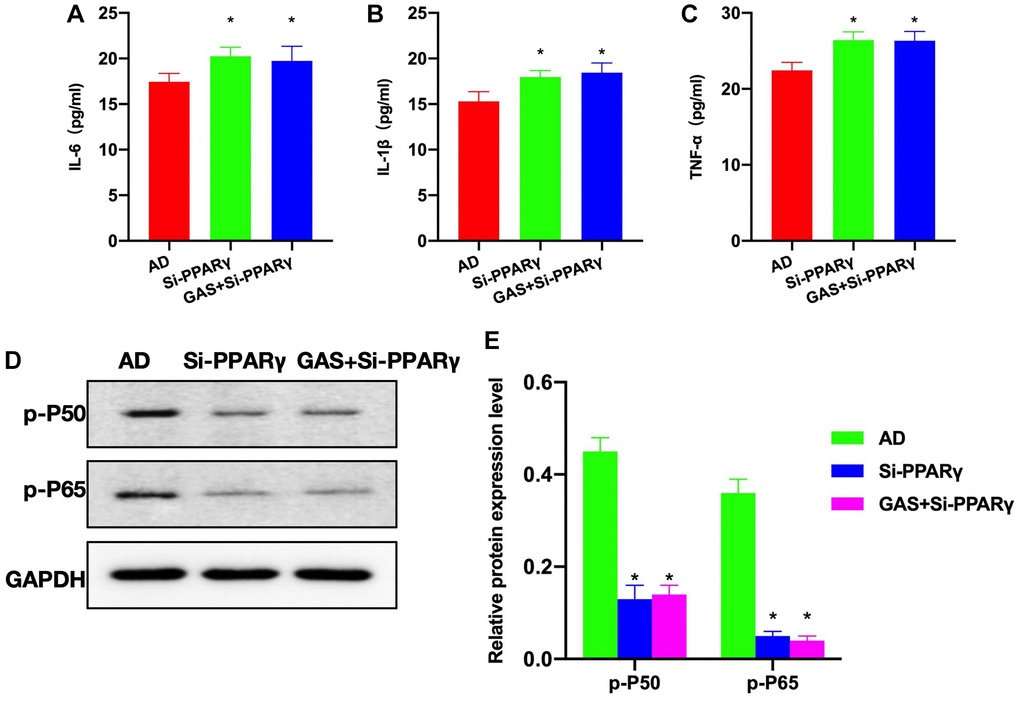
Figure 6.Effects of PPARγ silencing on the AD mice pathology. (A–C) ELISA (n = 10), Si-PAPRγ and GAS+Si-PPARγ groups exhibited higher levels of inflammatory cytokines compared to the AD group. (D, E) Relative protein expressions (n = 5), p-P50 and p-P65 expressions differed insignificantly between the Si-PAPRγ and GAS+Si-PPARγ groups. *P < 0.05 vs. AD.