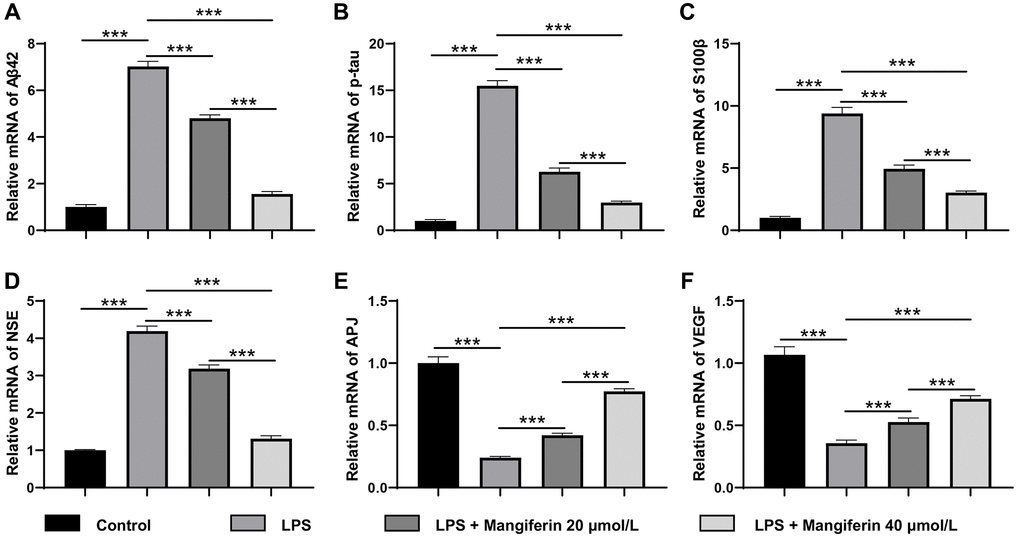
Figure 8.Mangiferin eliminates pathogenic proteins and increases neuroprotective factors in LPS-challenged cells by RT-PCR. (A) The relative mRNA levels of Aβ42 in LPS, 20 μmol/L mangiferin with LPS, and 40 μmol/L mangiferin with LPS compared to control are 7.02, 4.80, and 1.56 times, respectively, all ***P < 0.001. One-way ANOVA, F = 1199, ***P < 0.001. (B) Relative mRNA levels of p-tau in LPS, 20 μmol/L mangiferin with LPS, and 40 μmol/L mangiferin with LPS compared to control are 15.49, 6.27, and 3.00 times, respectively, all ***P < 0.001. One-way ANOVA, F = 1013, ***P < 0.001. (C) Relative mRNA levels of S100β in LPS, 20 μmol/L mangiferin with LPS, and 40 μM mangiferin with LPS compared to the control are 9.39, 4.95, and 3.03, respectively, all ***P < 0.001. One-way ANOVA, F = 446, ***P < 0.001. (D) Relative mRNA levels of NSE in LPS, 20 μmol/L mangiferin with LPS, 40 μmol/L mangiferin with LPS compared to control were 4.19, 3.19, and 1.31 times, respectively, all ***P < 0.001. One-way ANOVA, F = 834, ***P < 0.001. (E) Relative mRNA levels of APJ in LPS, 20 μmol/L mangiferin with LPS, and 40 μmol/L mangiferin with LPS compared to control are 0.24, 0.42, and 0.77 times, respectively, all ***P < 0.001. One-way ANOVA, F = 1688, ***P < 0.001. (F) Relative mRNA levels of VEGF in LPS, 20 μmol/L mangiferin with LPS, and 40 μmol/L mangiferin with LPS compared to control are 0.36, 0.53, and 0.71 times, respectively, all ***P < 0.001. One-way ANOVA, F = 396, ***P < 0.001.