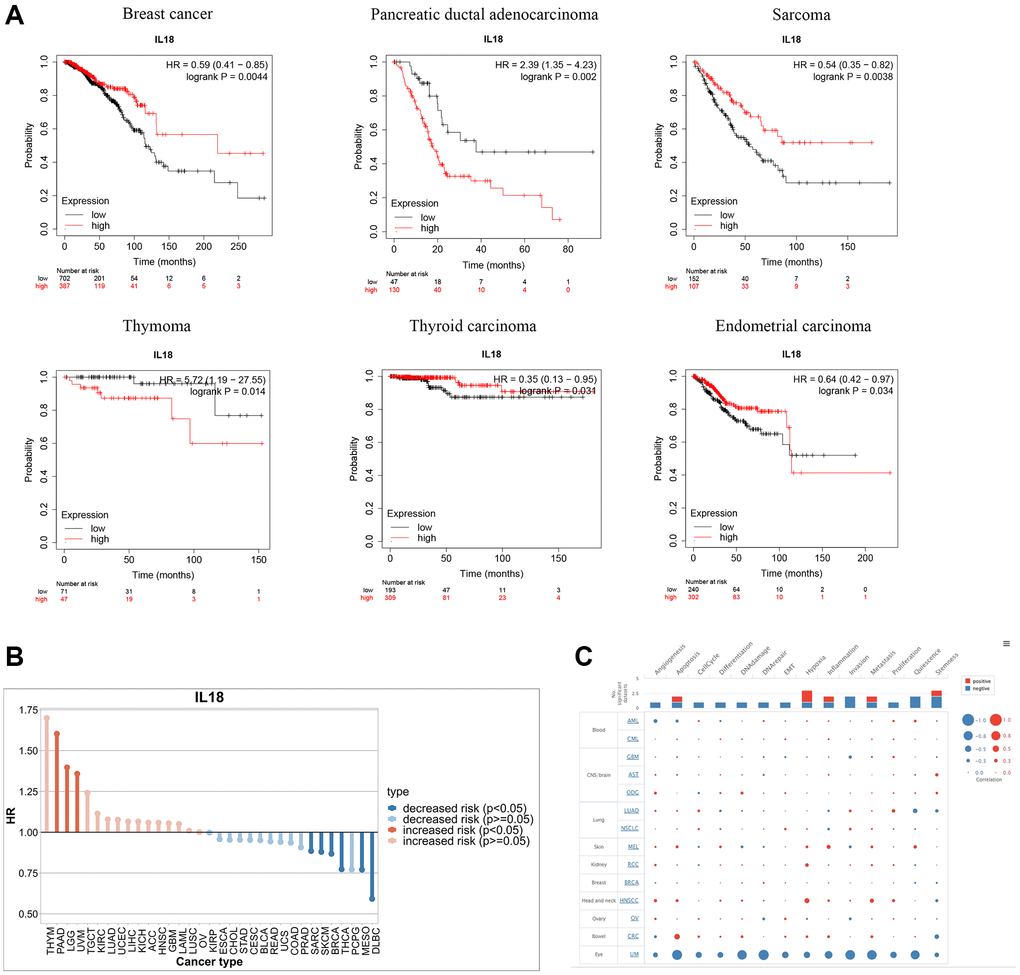
Figure 7.Functional enrichment analysis of IL18 in Pan-cancer. (A) Kaplan-Meier curves show the OS survival of IL18 in Pan-cancer. (B) The difference in prognostic risk for IL18 in Pan-cancer. (C) The bubble map reveals the biological enrichment of IL18 in Pan-cancer.