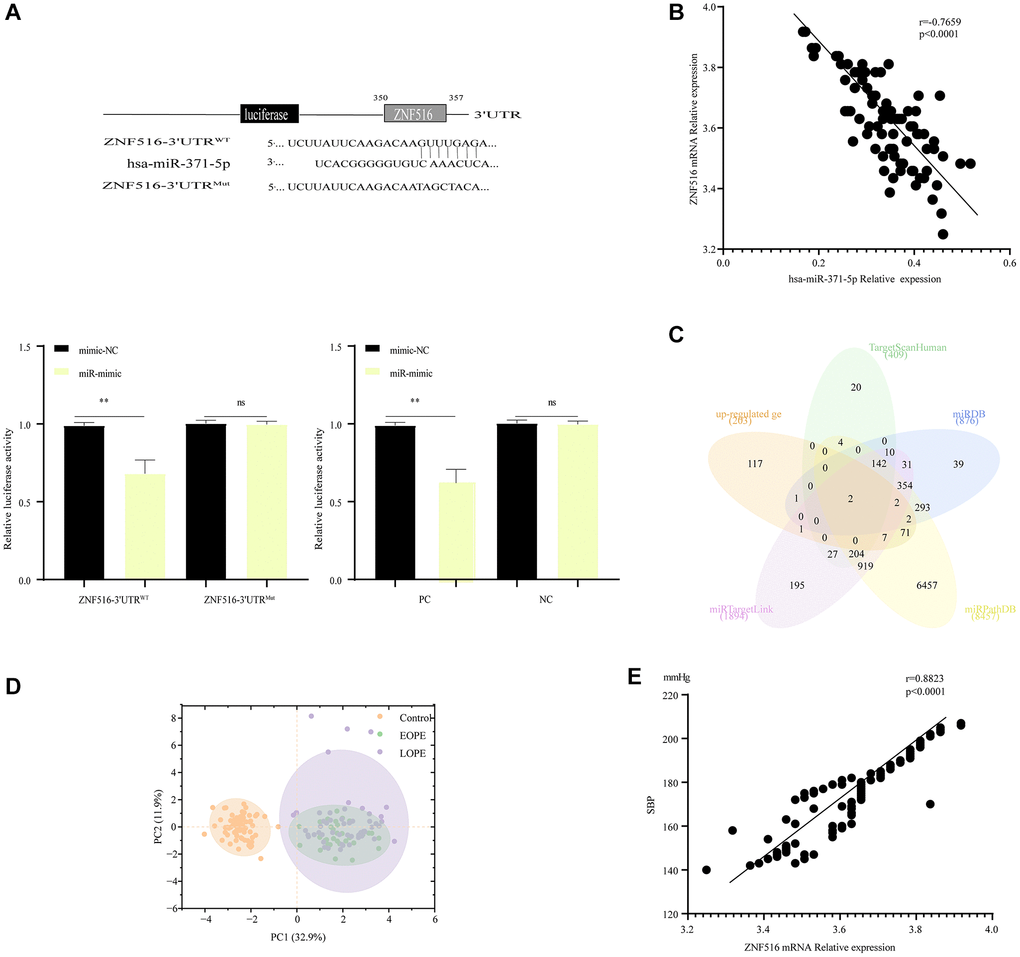
Figure 3.MiR-371-5p suppressed trophoblast cell proliferation, migration, and invasion via lowering ZNF516 expression. (A) The sequences of hsa-miR-371-5p and the 3′ untranslated region (3′UTR) of ZNF516, where it is believed to bind. The upper panel illustrates the specific nucleotides altered in the ZNF516-3′UTR mutant. The luciferase activity of ZNF516 with a wild-type 3′-UTR was dramatically inhibited by miR-371-5p; however, no effect on ZNF516 with a mutant 3′-UTR was observed. Conversely, the luciferase activity of ZNF516 cells increased after treatment with anti-miR-371-5p, as shown in the lower panel. The statistical significance levels are *P < 0.05 and **P < 0.01. In this context, NC refers to the negative control, representing the wild-type mutant. (B) The Venn diagram displays target genes of hsa-miR-371-5p predicted by the TargetScan, miRDB, miRPathDB, and miRTargetLink websites and the upregulated genes in the GSE96985 dataset. (C) A scatter map was generated to illustrate the significant inverse association between the levels of hsa-miR-371-5p and ZNF516 mRNA in 89 placental samples from patients with PE. (D) After incorporating batch effects as covariates into the linear model, principal component analysis (PCA) plots are provided for each of the 160 samples. The plot displays individual samples, which are represented by dots. The dots are colored according to the disease condition: yellow for healthy pregnant women (control), purple for patients with early-onset preeclampsia (EOPE), and green for patients with late-onset preeclampsia (LOPE). (E) A scatter plot was generated to illustrate the significant inverse association observed between the levels of ZNF516 mRNA and SBP in a sample of individuals with PE. n = 89, P < 0.0001. Abbreviation: SBP: systolic blood pressure.