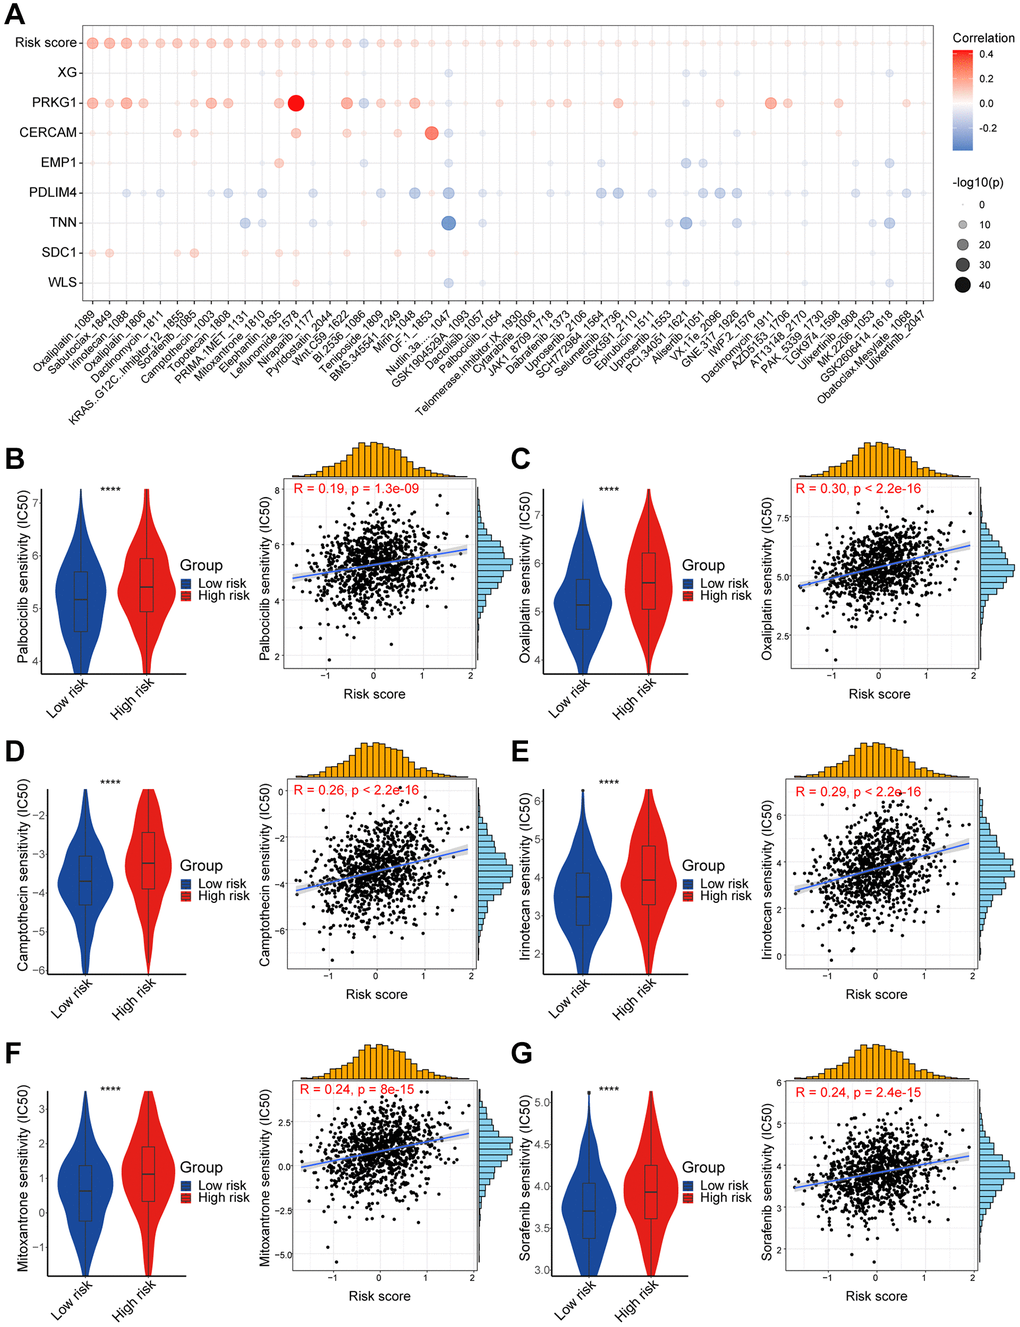
Figure 8.High- and low-risk group patients differ in drug sensitivity. (A) Bubble plot showing the relationship between IC50 of drugs, risk score, and model genes. (B) Boxplot showing the comparison of IC50 of Palbociclib between high/low-risk groups, and scatter plot showing the correlation between the IC50 of drug and risk score. (C) Boxplot showing the comparison of IC50 of Oxaliplatin between high/low-risk groups, and scatter plot showing the correlation between the IC50 of drug and risk score. (D) Boxplot showing the comparison of IC50 of Camptothecin between high/low-risk groups, and scatter plot showing the correlation between the IC50 of drug and risk score. (E) Boxplot showing the comparison of IC50 of Irinotecan between high/low-risk groups, and scatter plot showing the correlation between the IC50 of drug and risk score. (F) Boxplot showing the comparison of IC50 of Mitoxantrone between high/low-risk groups, and scatter plot showing the correlation between the IC50 of drug and risk score. (G) Boxplot showing the comparison of IC50 of Sorafenib between high/low-risk groups, and scatter plot showing the correlation between the IC50 of drug and risk score. The asterisks represent the statistical P-value (****p < 0.0001).