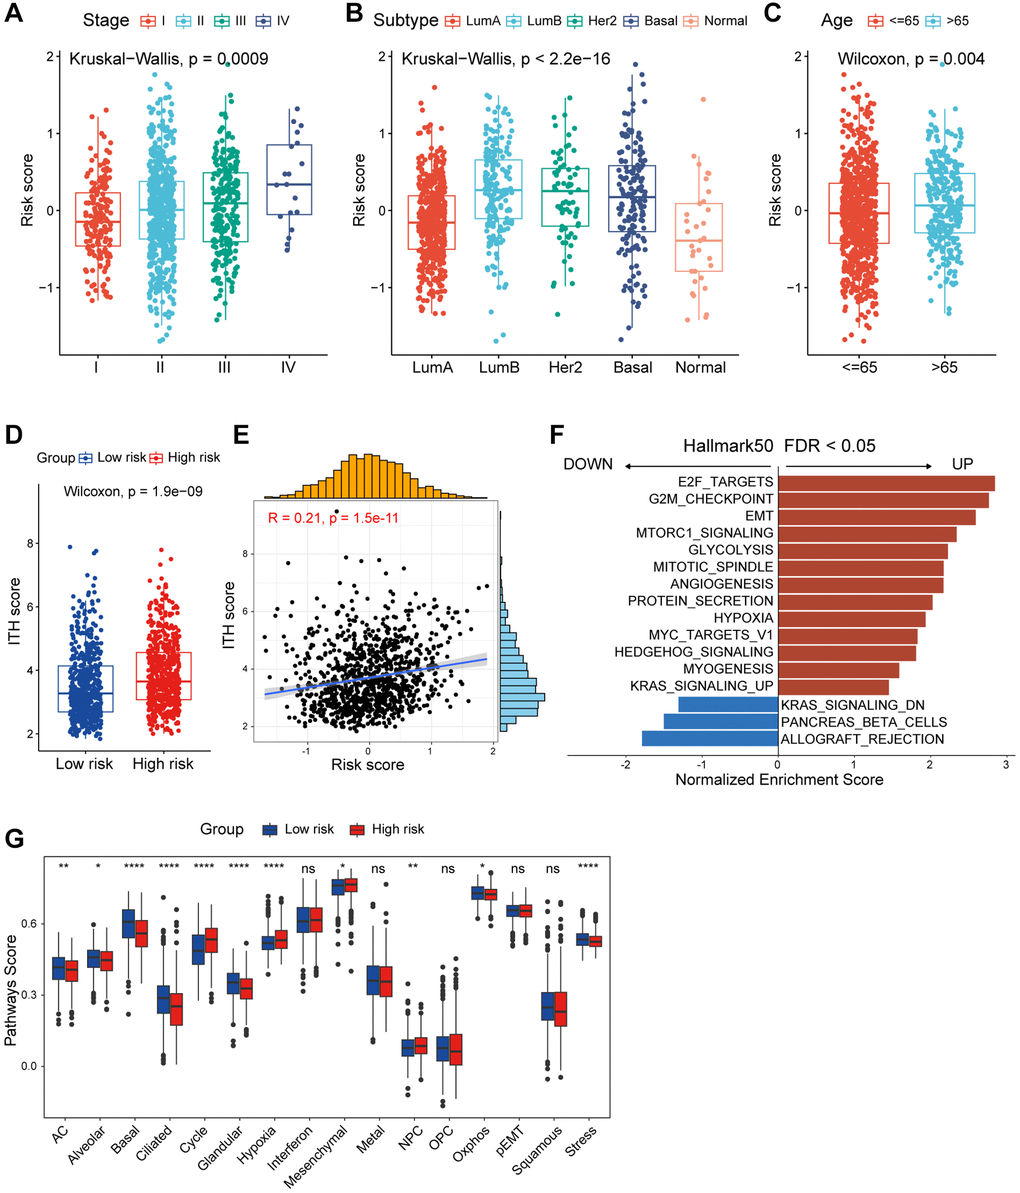
Figure 4.Functional and genomic features of CAF-related risk score-based classification. (A) Levels of risk score in different tumor stages of breast cancer. (B) Levels of risk score in different molecular subtypes of breast cancer. (C) Levels of risk score in different age groups of breast cancer. (D) Boxplot showing the levels of ITH in high/low-risk groups. Paired two-sided Wilcoxon test. (E) Scatter plot showing the correlation between the risk score and ITH score. (F) Bar plot showing different pathways enriched in high/low-risk groups of breast cancer calculated by GSEA. (G) Boxplots showing the signature score of 16 cancer cell states in high/low-risk groups of breast cancer scored by GSVA. Paired two-sided Wilcoxon test. The asterisks represent the statistical P-value (*p < 0.05; **p < 0.01; ***p < 0.001; ****p < 0.0001; nsp > 0.05).