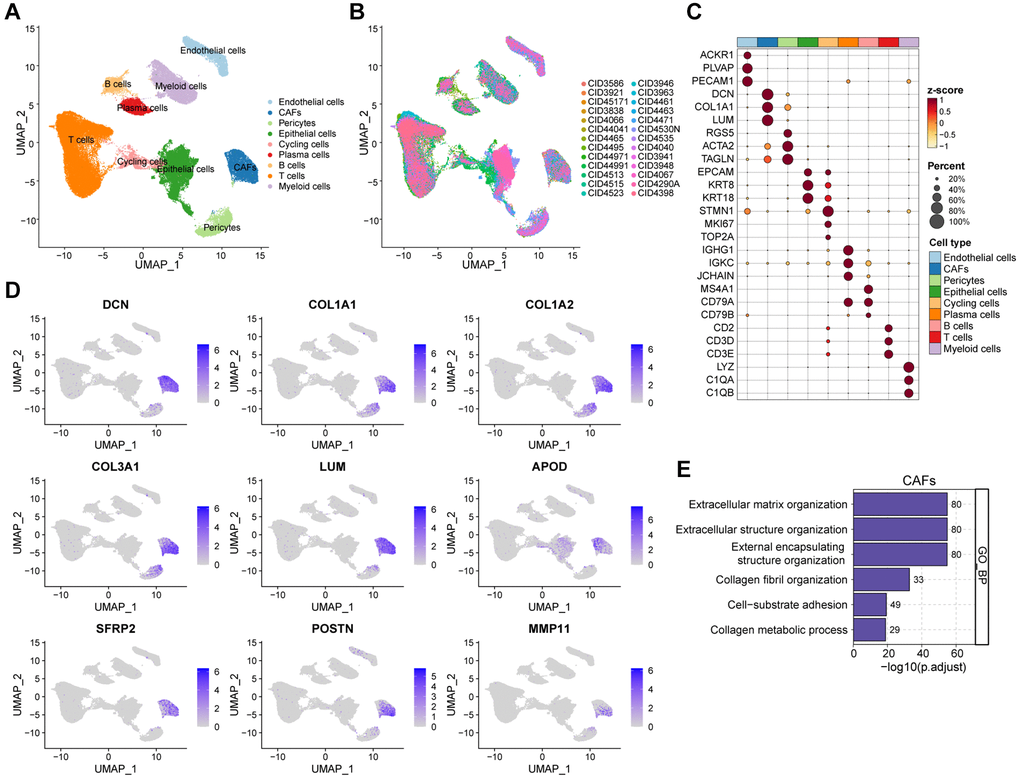
Figure 1.Interrogating the cellular constitution of breast cancer at single-cell resolution. (A, B) UMAP plot showing the major cell subpopulations in breast cancer. (C) Bubble heatmap showing expression levels of selected signature genes in breast cancer. Dot size indicates fraction of expressing cells, colored based on normalized expression levels. (D) Feature plots to further identify various CAFs, based on the expression levels of marker genes. (E) GO enrichment of CAFs signature genes.