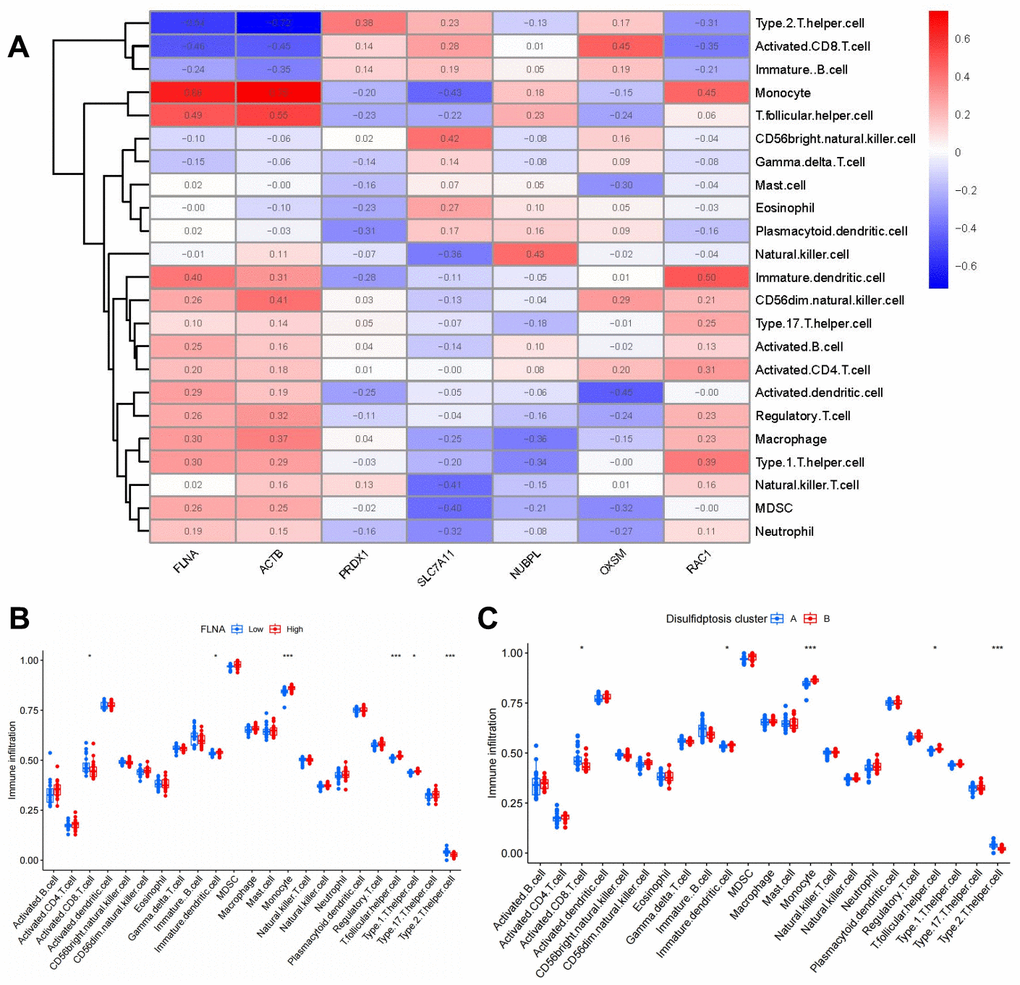
Figure 7.Single-sample gene set enrichment analysis. (A) Correlations between immune cell infiltration and seven significant disulfidptosis modulators. (B) Differences in abundance of infiltrating immune cells between high- and low-FLNA protein expression groups. (C) Differential immune cell infiltration between cluster A and cluster B. *P < 0.05, ***P < 0.001.