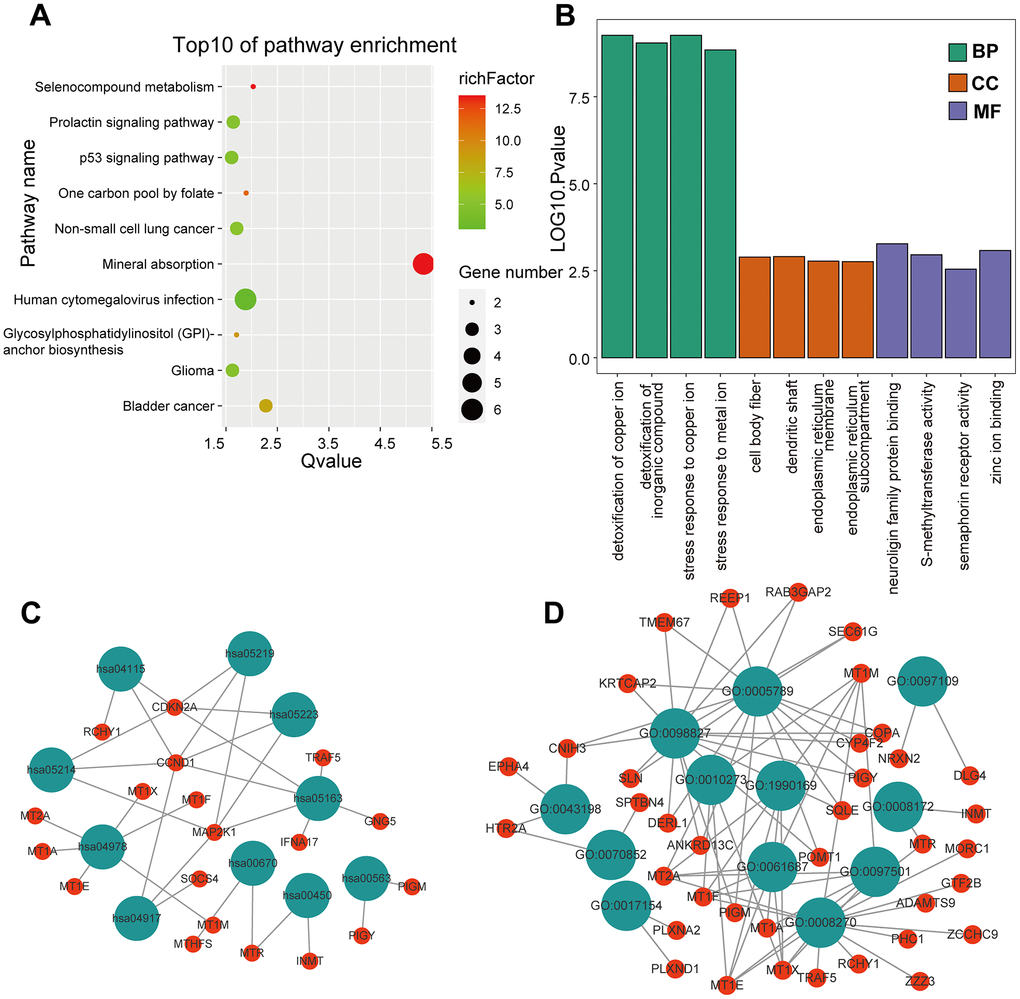
Figure 4.GO and KEGG enrichment analysis in the GEO cohort. (A) The bubble graph package was applied to visualize the results of KEGG enrichment analysis; the bubble size represented the number of enriched genes, and the color represented the enrichment ratio in the GSE33382 data set. (B) The bar graph for GO enrichment analysis; length represented significance in the GSE33382 data set. (C) A functional enrichment network based on KEGG analysis of the GSE33382 data set. (D) A functional enrichment network based on GO analysis of the GSE33382 data set.