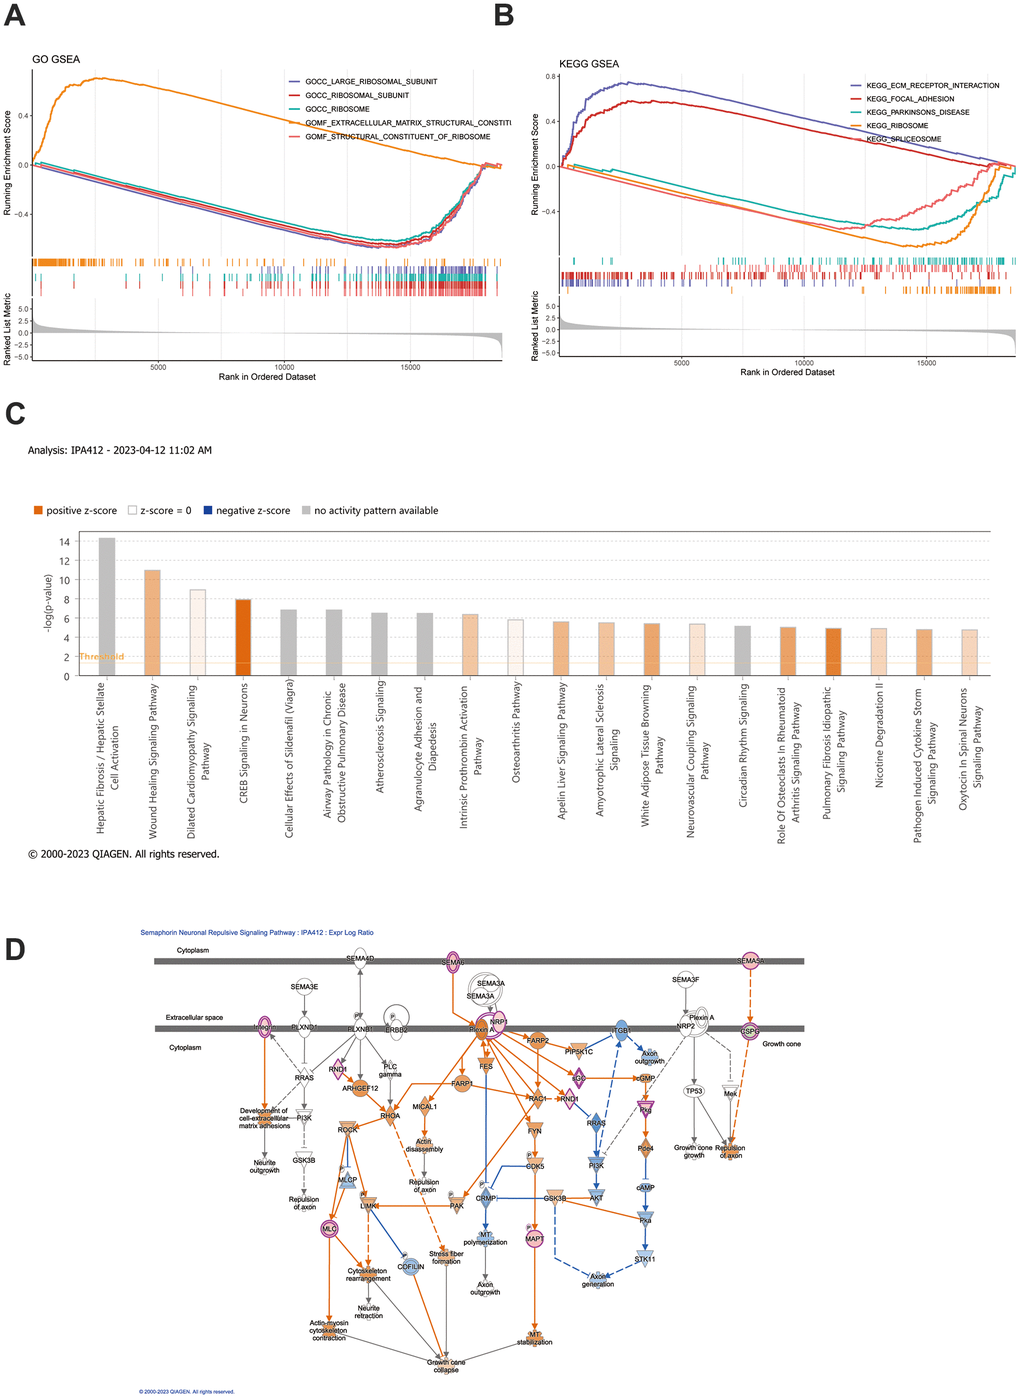
Figure 4.GSEA and IPA analysis. (A, B) GSEA enrichment analysis was conducted based on both GO gene sets and KEGG gene sets. The top 5 most significant pathways were selected for depiction in the GSEA enrichment analysis. (C) IPA examination uncovers the abundance of distinct gene expression between the high-risk and low-risk groups. (D) Depiction of the functional roles of the key mRNAs in the signaling pathway corresponds to the highest absolute z-score.