Submit an Article
Navigate
Home
Editorial Board
Editorial Policies
Current Volume
Archive
Scientific Integrity
Publication Ethics Statements
Interviews with Outstanding Authors
Newsroom
Sponsored Conferences
Podcast
Contact
Special Collections
Submit an Article
Online ISSN: 1945-4589
Research Paper
|
Volume 16, Issue 9
|
pp. 8044–8069
Bioinformatics analysis for constructing a cellular senescence-related age-related macular degeneration diagnostic model and identifying relevant disease subtypes to guide treatment
Back to article
Figure 10
(10 of 12)
−
100%
+
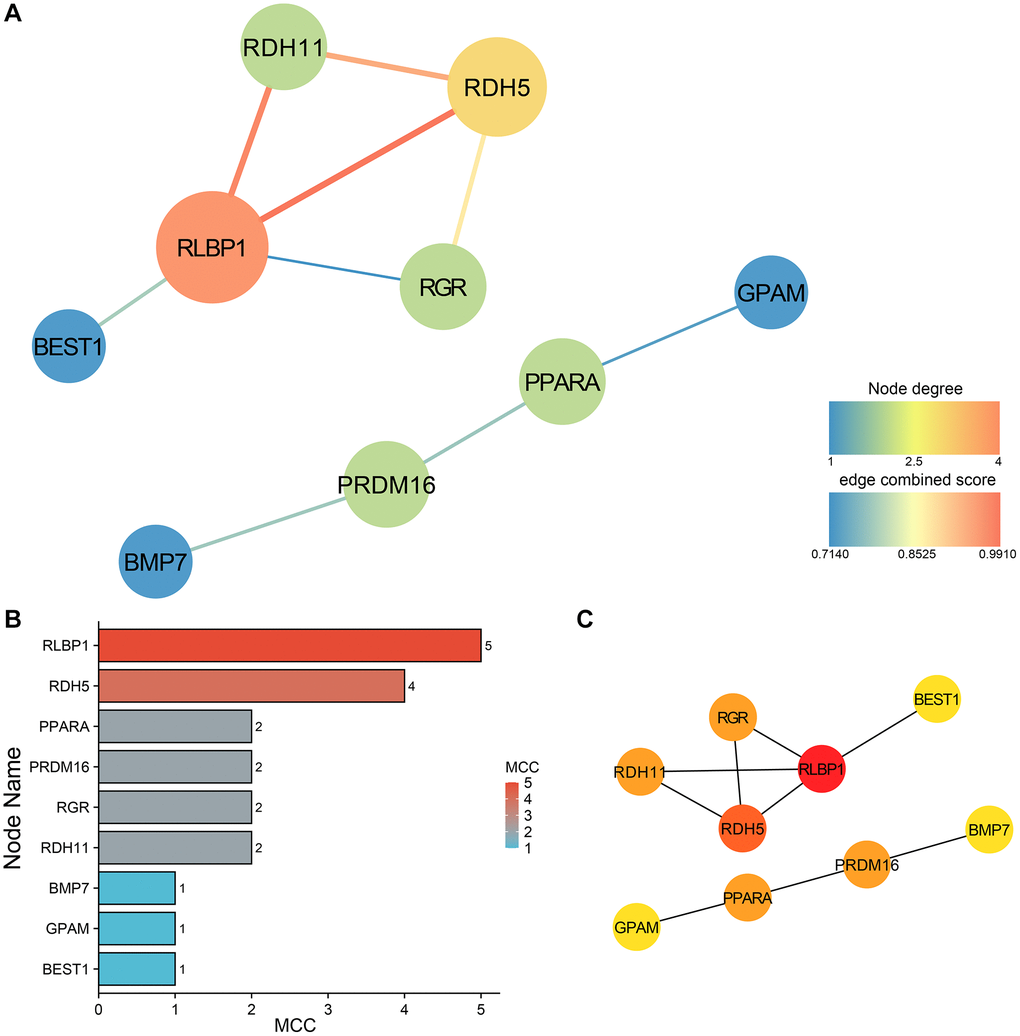
Figure 10.
PPI network construction and analysis of subtype A.
(
A
) The PPI network of the 9 hub genes. (
B
) MCC ranking based on the degree of nodes. (
C
) The genes ranked by MCC, exhibit an increase in MCC scores as indicated by the deepening color.