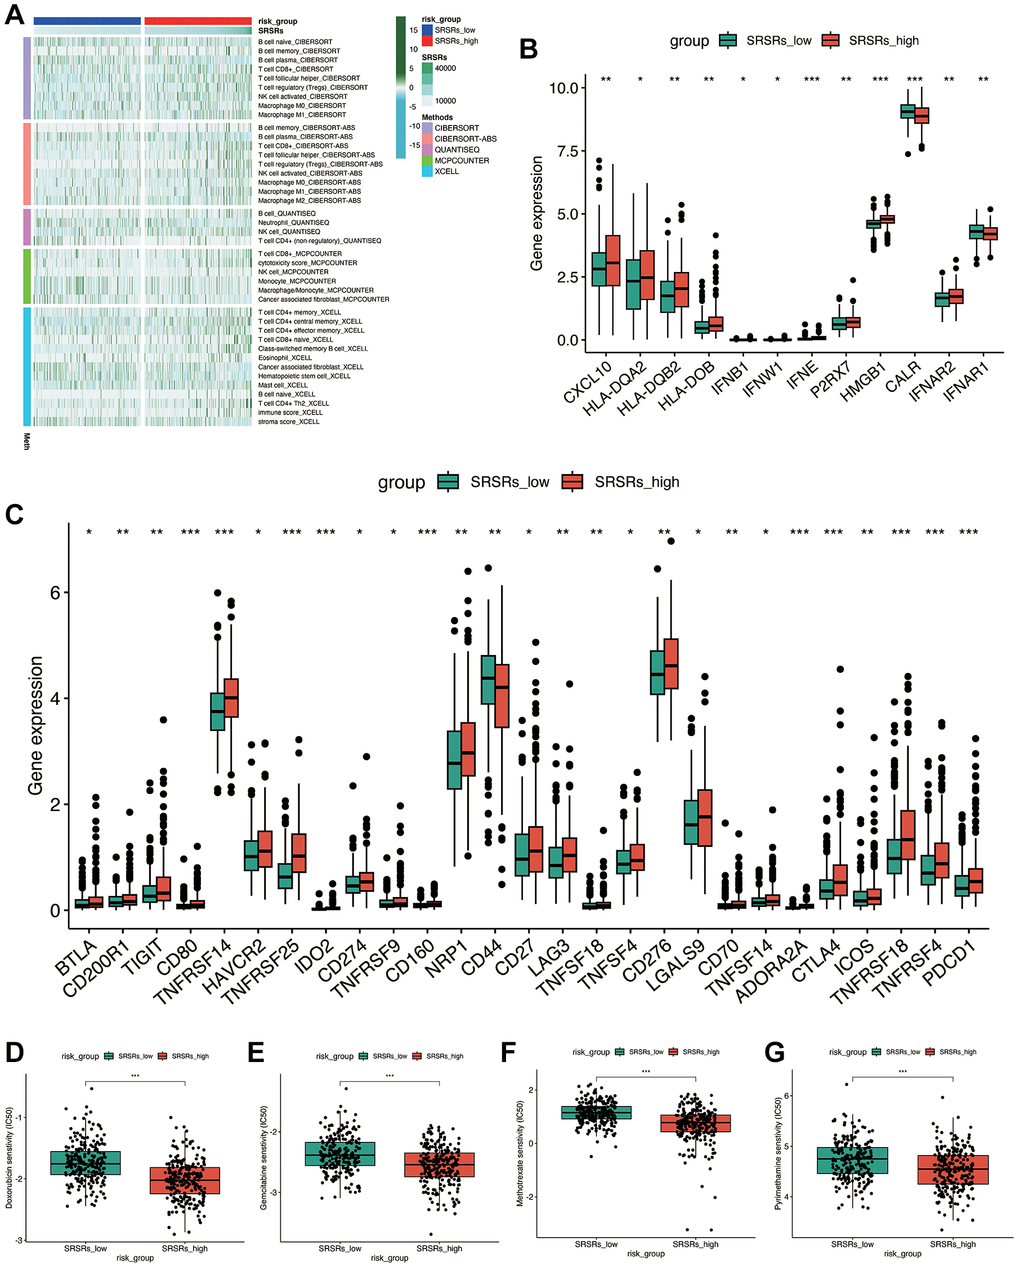
Figure 6.Immune cell infiltration and drug sensitivity analysis. (A) Immune cell infiltration landscape between SRSRs_high group and SRSRs_low group. (B, C) The expression level of leukocyte antigen genes, immune checkpoint genes and tumor necrosis genes between SRSRs_high group and SRSRs_low group. (D–G) Drug sensitivity analysis.