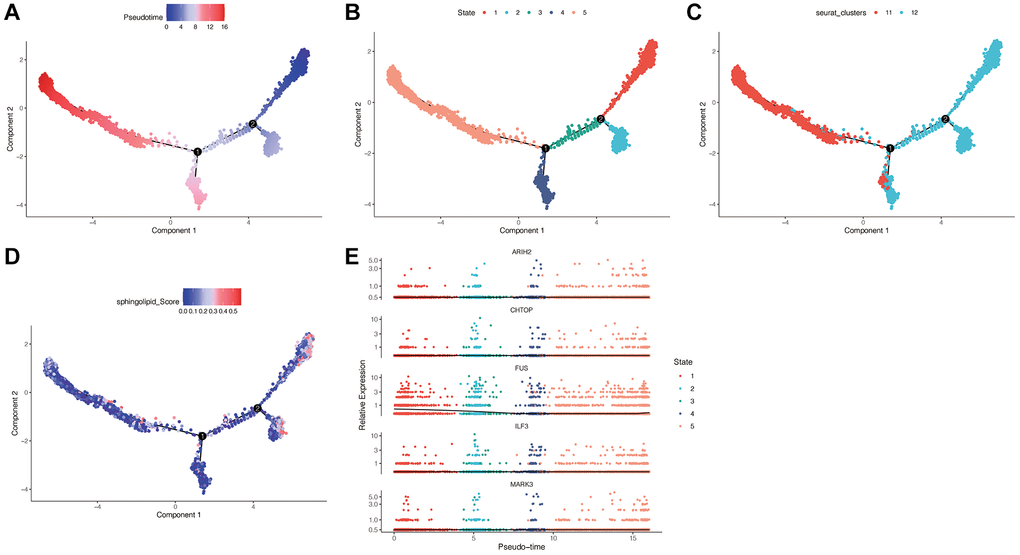
Figure 5.Pseudo-time series analysis. (A) Darker blue indicates early cell differentiation, while darker red indicates late differentiation. (B) Different cell differentiation states in total. (C) Different clusters. (D) The relation between sphingolipid enrichment score and cell differentiation. (E) The expression of FUS genes is gradually down-regulated as Fibroblast Cells differentiate.