Submit an Article
Navigate
Home
Editorial Board
Editorial Policies
Current Volume
Archive
Scientific Integrity
Publication Ethics Statements
Interviews with Outstanding Authors
Newsroom
Sponsored Conferences
Podcast
Contact
Special Collections
Submit an Article
Online ISSN: 1945-4589
Research Paper
|
Volume 16, Issue 9
|
pp. 8031–8043
Sphingolipids in prostate cancer prognosis: integrating single-cell and bulk sequencing
Back to article
Figure 4
(4 of 8)
−
100%
+
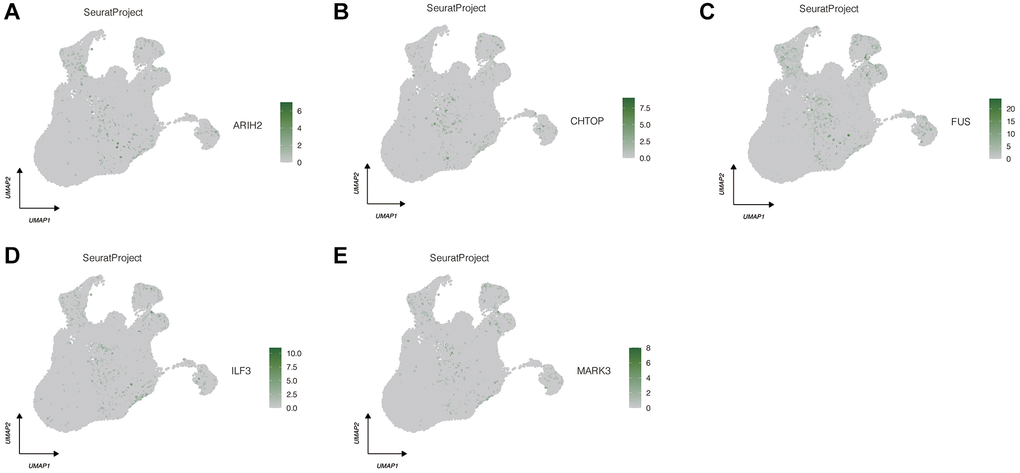
Figure 4.
Expression localization of 5 model genes in different cell types.
(
A
) ARIH2. (
B
) CHTOP. (
C
) FUS. (
D
) ILF3. (
E
) MARK3.