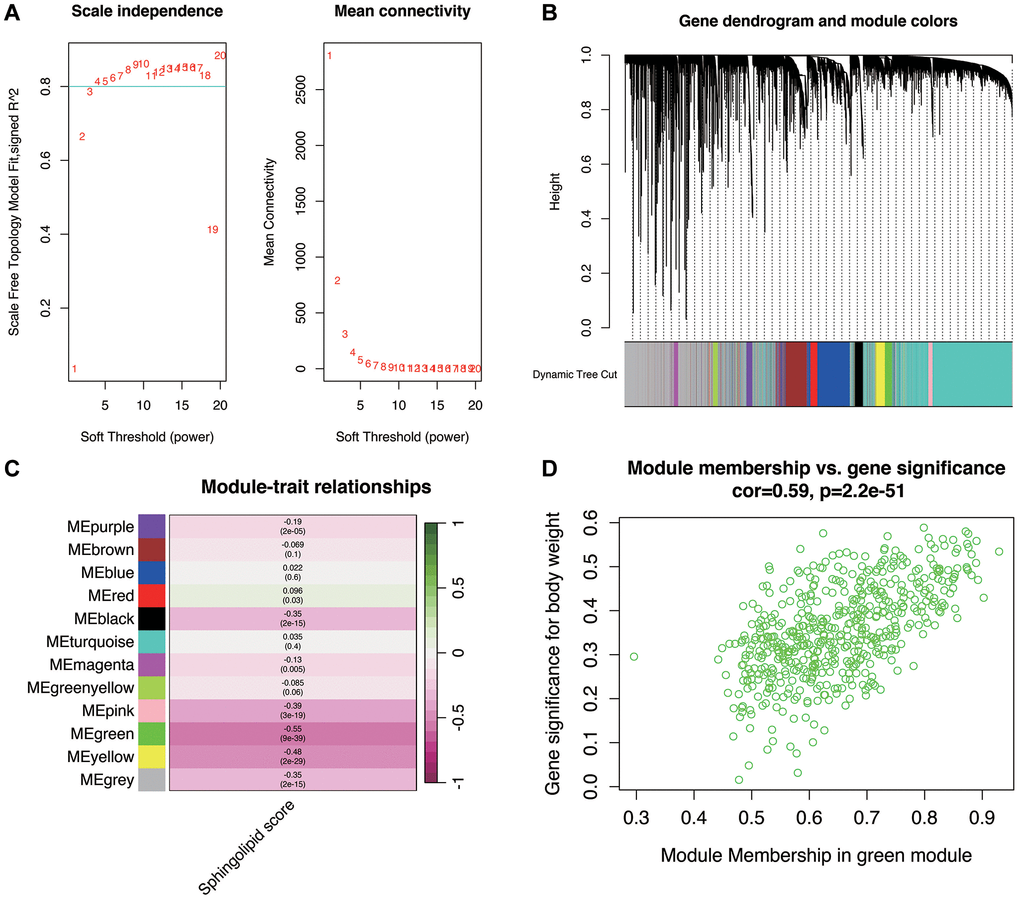
Figure 2.Weighted gene coexpression network analysis. (A) When the optimal soft threshold is 7, the data conform to the power law distribution, and the Mean connectivity tends to be stable. (B, C) Genes clusters. They were clustered into 11 non-gray modules, of which the green module was most correlated with the sphingolipid metabolism phenotype. (D) Correlation of green modules.